SolarSystem - Blog Posts
8 Common Questions About Our James Webb Space Telescope
You might have heard the basics about our James Webb Space Telescope, or Webb, and still have lots more questions! Here are more advanced questions we are frequently asked. (If you want to know the basics, read this Tumblr first!)
Webb is our upcoming infrared space observatory, which will launch in 2021. It will spy the first luminous objects that formed in the universe and shed light on how galaxies evolve, how stars and planetary systems are born, and how life could form on other planets.
1. Why is the mirror segmented?
The James Webb Space Telescope has a 6.5-meter (21.3-foot) diameter mirror, made from 18 individual segments. Webb needs to have an unfolding mirror because the mirror is so large that it otherwise cannot fit in the launch shroud of currently available rockets.

The mirror has to be large in order to see the faint light from the first star-forming regions and to see very small details at infrared wavelengths.

Designing, building, and operating a mirror that unfolds is one of the major technological developments of Webb. Unfolding mirrors will be necessary for future missions requiring even larger mirrors, and will find application in other scientific, civil, and military space missions.
2. Why are the mirrors hexagonal?
In short, the hexagonal shape allows a segmented mirror to be constructed with very small gaps, so the segments combine to form a roughly circular shape and need only three variations in prescription. If we had circular segments, there would be gaps between them.

Finally, we want a roughly circular overall mirror shape because that focuses the light into the most symmetric and compact region on the detectors.

An oval mirror, for example, would give images that are elongated in one direction. A square mirror would send a lot of the light out of the central region.
3. Is there a danger from micrometeoroids?
A micrometeoroid is a particle smaller than a grain of sand. Most never reach Earth's surface because they are vaporized by the intense heat generated by the friction of passing through the atmosphere. In space, no blanket of atmosphere protects a spacecraft or a spacewalker.
Webb will be a million miles away from the Earth orbiting what we call the second Lagrange point (L2). Unlike in low Earth orbit, there is not much space debris out there that could damage the exposed mirror.

But we do expect Webb to get impacted by these very tiny micrometeoroids for the duration of the mission, and Webb is designed to accommodate for them.

All of Webb's systems are designed to survive micrometeoroid impacts.
4. Why does the sunshield have five layers?
Webb has a giant, tennis-court sized sunshield, made of five, very thin layers of an insulating film called Kapton.
Why five? One big, thick sunshield would conduct the heat from the bottom to the top more than would a shield with five layers separated by vacuum. With five layers to the sunshield, each successive one is cooler than the one below.

The heat radiates out from between the layers, and the vacuum between the layers is a very good insulator. From studies done early in the mission development five layers were found to provide sufficient cooling. More layers would provide additional cooling, but would also mean more mass and complexity. We settled on five because it gives us enough cooling with some “margin” or a safety factor, and six or more wouldn’t return any additional benefits.
Fun fact: You could nearly boil water on the hot side of the sunshield, and it is frigid enough on the cold side to freeze nitrogen!
5. What kind of telescope is Webb?

Webb is a reflecting telescope that uses three curved mirrors. Technically, it’s called a three-mirror anastigmat.
6. What happens after launch? How long until there will be data?
We’ll give a short overview here, but check out our full FAQ for a more in-depth look.
In the first hour: About 30 minutes after liftoff, Webb will separate from the Ariane 5 launch vehicle. Shortly after this, we will talk with Webb from the ground to make sure everything is okay after its trip to space.

In the first day: After 24 hours, Webb will be nearly halfway to the Moon! About 2.5 days after launch, it will pass the Moon’s orbit, nearly a quarter of the way to Lagrange Point 1 (L2).

In the first week: We begin the major deployment of Webb. This includes unfolding the sunshield and tensioning the individual membranes, deploying the secondary mirror, and deploying the primary mirror.

In the first month: Deployment of the secondary mirror and the primary mirror occur. As the telescope cools in the shade of the sunshield, we turn on the warm electronics and initialize the flight software. As the telescope cools to near its operating temperature, parts of it are warmed with electronic heaters. This prevents condensation as residual water trapped within some of the materials making up the observatory escapes into space.

In the second month: We will turn on and operate Webb’s Fine Guidance Sensor, NIRCam, and NIRSpec instruments.

The first NIRCam image, which will be an out-of-focus image of a single bright star, will be used to identify each mirror segment with its image of a star in the camera. We will also focus the secondary mirror.

In the third month: We will align the primary mirror segments so that they can work together as a single optical surface. We will also turn on and operate Webb’s mid-infrared instrument (MIRI), a camera and spectrograph that views a wide spectrum of infrared light. By this time, Webb will complete its journey to its L2 orbit position.

In the fourth through the sixth month: We will complete the optimization of the telescope. We will test and calibrate all of the science instruments.
After six months: The first scientific images will be released, and Webb will begin its science mission and start to conduct routine science operations.

7. Why not assemble it in orbit?
Various scenarios were studied, and assembling in orbit was determined to be unfeasible.
We examined the possibility of in-orbit assembly for Webb. The International Space Station does not have the capability to assemble precision optical structures. Additionally, space debris that resides around the space station could have damaged or contaminated Webb’s optics. Webb’s deployment happens far above low Earth orbit and the debris that is found there.

Finally, if the space station were used as a stopping point for the observatory, we would have needed a second rocket to launch it to its final destination at L2. The observatory would have to be designed with much more mass to withstand this “second launch,” leaving less mass for the mirrors and science instruments.
8. Who is James Webb?
This telescope is named after James E. Webb (1906–1992), our second administrator. Webb is best known for leading Apollo, a series of lunar exploration programs that landed the first humans on the Moon.

However, he also initiated a vigorous space science program that was responsible for more than 75 launches during his tenure, including America's first interplanetary explorers.
Looking for some more in-depth FAQs? You can find them HERE.
Learn more about the James Webb Space Telescope HERE, or follow the mission on Facebook, Twitter and Instagram.
Make sure to follow us on Tumblr for your regular dose of space!
Using All of Our Senses in Space
Today, we and the National Science Foundation (NSF) announced the detection of light and a high-energy cosmic particle that both came from near a black hole billions of trillions of miles from Earth. This discovery is a big step forward in the field of multimessenger astronomy.
But wait — what is multimessenger astronomy? And why is it a big deal?
People learn about different objects through their senses: sight, touch, taste, hearing and smell. Similarly, multimessenger astronomy allows us to study the same astronomical object or event through a variety of “messengers,” which include light of all wavelengths, cosmic ray particles, gravitational waves, and neutrinos — speedy tiny particles that weigh almost nothing and rarely interact with anything. By receiving and combining different pieces of information from these different messengers, we can learn much more about these objects and events than we would from just one.

Lights, Detector, Action!
Much of what we know about the universe comes just from different wavelengths of light. We study the rotations of galaxies through radio waves and visible light, investigate the eating habits of black holes through X-rays and gamma rays, and peer into dusty star-forming regions through infrared light.

The Fermi Gamma-ray Space Telescope, which recently turned 10, studies the universe by detecting gamma rays — the highest-energy form of light. This allows us to investigate some of the most extreme objects in the universe.

Last fall, Fermi was involved in another multimessenger finding — the very first detection of light and gravitational waves from the same source, two merging neutron stars. In that instance, light and gravitational waves were the messengers that gave us a better understanding of the neutron stars and their explosive merger into a black hole.

Fermi has also advanced our understanding of blazars, which are galaxies with supermassive black holes at their centers. Black holes are famous for drawing material into them. But with blazars, some material near the black hole shoots outward in a pair of fast-moving jets. With blazars, one of those jets points directly at us!
Multimessenger Astronomy is Cool

Today’s announcement combines another pair of messengers. The IceCube Neutrino Observatory lies a mile under the ice in Antarctica and uses the ice itself to detect neutrinos. When IceCube caught a super-high-energy neutrino and traced its origin to a specific area of the sky, they alerted the astronomical community.
Fermi completes a scan of the entire sky about every three hours, monitoring thousands of blazars among all the bright gamma-ray sources it sees. For months it had observed a blazar producing more gamma rays than usual. Flaring is a common characteristic in blazars, so this did not attract special attention. But when the alert from IceCube came through about a neutrino coming from that same patch of sky, and the Fermi data were analyzed, this flare became a big deal!

IceCube, Fermi, and followup observations all link this neutrino to a blazar called TXS 0506+056. This event connects a neutrino to a supermassive black hole for the very first time.

Why is this such a big deal? And why haven’t we done it before? Detecting a neutrino is hard since it doesn’t interact easily with matter and can travel unaffected great distances through the universe. Neutrinos are passing through you right now and you can’t even feel a thing!
The neat thing about this discovery — and multimessenger astronomy in general — is how much more we can learn by combining observations. This blazar/neutrino connection, for example, tells us that it was protons being accelerated by the blazar’s jet. Our study of blazars, neutrinos, and other objects and events in the universe will continue with many more exciting multimessenger discoveries to come in the future.
Want to know more? Read the story HERE.
Make sure to follow us on Tumblr for your regular dose of space: http://nasa.tumblr.com
Two Steps Forward in the Search for Life on Mars
We haven’t found aliens but we are a little further along in our search for life on Mars thanks to two recent discoveries from our Curiosity Rover.

We detected organic molecules at the harsh surface of Mars! And what’s important about this is we now have a lot more certainty that there’s organic molecules preserved at the surface of Mars. We didn’t know that before.
One of the discoveries is we found organic molecules just beneath the surface of Mars in 3 billion-year-old sedimentary rocks.

Second, we’ve found seasonal variations in methane levels in the atmosphere over 3 Mars years (nearly 6 Earth years). These two discoveries increase the chances that the record of habitability and potential life has been preserved on the Red Planet despite extremely harsh conditions on the surface.

Both discoveries were made by our chem lab that rides aboard the Curiosity rover on Mars.

Here’s an image from when we installed the SAM lab on the rover. SAM stands for “Sample Analysis at Mars” and SAM did two things on Mars for this discovery.
One - it tested Martian rocks. After the arm selects a sample of pulverized rock, it heats up that sample and sends that gas into the chamber, where the electron stream breaks up the chemicals so they can be analyzed.
What SAM found are fragments of large organic molecules preserved in ancient rocks which we think come from the bottom of an ancient Martian lake. These organic molecules are made up of carbon and hydrogen, and can include other elements like nitrogen and oxygen. That’s a possible indicator of ancient life…although non-biological processes can make organic molecules, too.
The other action SAM did was ‘sniff’ the air.

When it did that, it detected methane in the air. And for the first time, we saw a repeatable pattern of methane in the Martian atmosphere. The methane peaked in the warm, summer months, and then dropped in the cooler, winter months.

On Earth, 90 percent of methane is produced by biology, so we have to consider the possibility that Martian methane could be produced by life under the surface. But it also could be produced by non-biological sources. Right now, we don’t know, so we need to keep studying the Mars!

One of our upcoming Martian missions is the InSight lander. InSight, short for Interior Exploration using Seismic Investigations, Geodesy and Heat Transport, is a Mars lander designed to give the Red Planet its first thorough checkup since it formed 4.5 billion years ago. It is the first outer space robotic explorer to study in-depth the "inner space" of Mars: its crust, mantle, and core.
Finding methane in the atmosphere and ancient carbon preserved on the surface gives scientists confidence that our Mars 2020 rover and ESA’s (European Space Agency's) ExoMars rover will find even more organics, both on the surface and in the shallow subsurface.
Read the full release on today’s announcement HERE.
Make sure to follow us on Tumblr for your regular dose of space: http://nasa.tumblr.com.

A cluster of newborn stars herald their birth in this interstellar picture obtained with our Spitzer Space Telescope. These bright young stars are found in a rosebud-shaped (and rose-colored) nebulosity. The star cluster and its associated nebula are located at a distance of 3300 light-years in the constellation Cepheus.
A recent census of the cluster reveals the presence of 130 young stars. The stars formed from a massive cloud of gas and dust that contains enough raw materials to create a thousand Sun-like stars. In a process that astronomers still poorly understand, fragments of this molecular cloud became so cold and dense that they collapsed into stars. Most stars in our Milky Way galaxy are thought to form in such clusters.
The Spitzer Space Telescope image was obtained with an infrared array camera that is sensitive to invisible infrared light at wavelengths that are about ten times longer than visible light. In this four-color composite, emission at 3.6 microns is depicted in blue, 4.5 microns in green, 5.8 microns in orange, and 8.0 microns in red. The image covers a region that is about one quarter the size of the full moon.
As in any nursery, mayhem reigns. Within the astronomically brief period of a million years, the stars have managed to blow a large, irregular bubble in the molecular cloud that once enveloped them like a cocoon. The rosy pink hue is produced by glowing dust grains on the surface of the bubble being heated by the intense light from the embedded young stars. Upon absorbing ultraviolet and visible-light photons produced by the stars, the surrounding dust grains are heated and re-emit the energy at the longer infrared wavelengths observed by Spitzer. The reddish colors trace the distribution of molecular material thought to be rich in hydrocarbons.
The cold molecular cloud outside the bubble is mostly invisible in these images. However, three very young stars near the center of the image are sending jets of supersonic gas into the cloud. The impact of these jets heats molecules of carbon monoxide in the cloud, producing the intricate green nebulosity that forms the stem of the rosebud.
Not all stars are formed in clusters. Away from the main nebula and its young cluster are two smaller nebulae, to the left and bottom of the central 'rosebud,'each containing a stellar nursery with only a few young stars.
Astronomers believe that our own Sun may have formed billions of years ago in a cluster similar to this one. Once the radiation from new cluster stars destroys the surrounding placental material, the stars begin to slowly drift apart.
Additional information about the Spitzer Space Telescope is available at http://www.spitzer.caltech.edu.
Make sure to follow us on Tumblr for your regular dose of space: http://nasa.tumblr.com.
Our Spacecraft Have Discovered a New Magnetic Process in Space
Just as gravity is one key to how things move on Earth, a process called magnetic reconnection is key to how electrically-charged particles speed through space. Now, our Magnetospheric Multiscale mission, or MMS, has discovered magnetic reconnection – a process by which magnetic field lines explosively reconfigure – occurring in a new and surprising way near Earth.

Invisible to the eye, a vast network of magnetic energy and particles surround our planet — a dynamic system that influences our satellites and technology. The more we understand the way those particles move, the more we can protect our spacecraft and astronauts both near Earth and as we explore deeper into the solar system.

Earth’s magnetic field creates a protective bubble that shields us from highly energetic particles that stream in both from the Sun and interstellar space. As this solar wind bathes our planet, Earth’s magnetic field lines get stretched. Like elastic bands, they eventually release energy by snapping and flinging particles in their path to supersonic speeds.

That burst of energy is generated by magnetic reconnection. It’s pervasive throughout the universe — it happens on the Sun, in the space near Earth and even near black holes.

Scientists have observed this phenomenon many times in Earth’s vast magnetic environment, the magnetosphere. Now, a new study of data from our MMS mission caught the process occurring in a new and unexpected region of near-Earth space. For the first time, magnetic reconnection was seen in the magnetosheath — the boundary between our magnetosphere and the solar wind that flows throughout the solar system and one of the most turbulent regions in near-Earth space.

The four identical MMS spacecraft — flying through this region in a tight pyramid formation — saw the event in 3D. The arrows in the data visualization below show the hundreds of observations MMS took to measure the changes in particle motion and the magnetic field.

The data show that this event is unlike the magnetic reconnection we’ve observed before. If we think of these magnetic field lines as elastic bands, the ones in this region are much smaller and stretchier than elsewhere in near-Earth space — meaning that this process accelerates particles 40 times faster than typical magnetic reconnection near Earth. In short, MMS spotted a completely new magnetic process that is much faster than what we’ve seen before.

What’s more, this observation holds clues to what’s happening at smaller spatial scales, where turbulence takes over the process of mixing and accelerating particles. Turbulence in space moves in random ways and creates vortices, much like when you mix milk into coffee. The process by which turbulence energizes particles in space is still a big area of research, and linking this new discovery to turbulence research may give insights into how magnetic energy powers particle jets in space.
Keep up with the latest discoveries from the MMS mission: @NASASun on Twitter and Facebook.com/NASASunScience.
Make sure to follow us on Tumblr for your regular dose of space: http://nasa.tumblr.com.
Earth: Your Home, Our Mission
We pioneer and support an amazing range of advanced technologies and tools to help us better understand our home planet, the solar system and far beyond.
Here are 5 ways our tech improves life here on Earth...
1. Eyes in the Sky Spot Fires on the Ground

Our Earth observing satellites enable conservation groups to spot and monitor fires across vast rainforests, helping them protect our planet on Earth Day and every day.
2. Helping Tractors Drive Themselves

There has been a lot of talk about self-driving cars, but farmers have already been making good use of self-driving tractors for more than a decade - due in part to a partnership between John Deere and our Jet Propulsion Laboratory.
Growing food sustainably requires smart technology - our GPS correction algorithms help self-driving tractors steer with precision, cutting down on water and fertilizer waste.
3. Turning Smartphones into Satellites

On Earth Day (and every day), we get nonstop "Earth selfies" thanks to Planet Labs' small satellites, inspired by smartphones and created by a team at our Ames Research Center. The high res imagery helps conservation efforts worldwide.
4. Early Flood Warnings

Monsoons, perhaps the least understood and most erratic weather pattern in the United States, bring rain vital to agriculture and ecosystems, but also threaten lives and property. Severe flash-flooding is common. Roads are washed out. Miles away from the cloudburst, dry gulches become raging torrents in seconds. The storms are often accompanied by driving winds, hail and barrages of lightning.
We are working to get better forecasting information to the National Oceanic and Atmospheric Administration (NOAA). Our satellites can track moisture in the air - helping forecasters provide an early warning of flash floods from monsoons.
5. Watching the World's Water

Around the world, agriculture is by far the biggest user of freshwater. Thanks in part to infrared imagery from Landsat, operated by the U.S. Geological Survey (USGS), we can now map, in real time, how much water a field is using, helping conserve that precious resource.
We use the vantage point of space to understand and explore our home planet, improve lives and safeguard our future. Our observations of Earth’s complex natural environment are critical to understanding how our planet’s natural resources and climate are changing now and could change in the future.
Join the celebration online by using #NASA4Earth.
Make sure to follow us on Tumblr for your regular dose of space: http://nasa.tumblr.com.
Earth from Afar
“It suddenly struck me that that tiny pea, pretty and blue, was the Earth. I put up my thumb and shut one eye, and my thumb blotted out the planet Earth. I didn't feel like a giant. I felt very, very small.” - Neil Armstrong, Apollo 11

This week we're celebrating Earth Day 2018 with some of our favorite images of Earth from afar...
At 7.2 million Miles...and 4 Billion Miles

Voyager famously captured two unique views of our homeworld from afar. One image, taken in 1977 from a distance of 7.3 million miles (11.7 million kilometers) (above), showed the full Earth and full Moon in a single frame for the first time in history. The second (below), taken in 1990 as part of a “family portrait of our solar system from 4 billion miles (6.4 billion kilometers), shows Earth as a tiny blue speck in a ray of sunlight.” This is the famous “Pale Blue Dot” image immortalized by Carl Sagan.

“This was our willingness to see the Earth as a one-pixel object in a far greater cosmos,” Sagan’s widow, Ann Druyan said of the image. “It's that humility that science gives us. That weans us from our childhood need to be the center of things. And Voyager gave us that image of the Earth that is so heart tugging because you can't look at that image and not think of how fragile, how fragile our world is. How much we have in common with everyone with whom we share it; our relationship, our relatedness, to everyone on this tiny pixel."
A Bright Flashlight in a Dark Sea of Stars

Our Kepler mission captured Earth’s image as it slipped past at a distance of 94 million miles (151 million kilometers). The reflection was so extraordinarily bright that it created a saber-like saturation bleed across the instrument’s sensors, obscuring the neighboring Moon.
Hello and Goodbye

This beautiful shot of Earth as a dot beneath Saturn’s rings was taken in 2013 as thousands of humans on Earth waved at the exact moment the spacecraft pointed its cameras at our home world. Then, in 2017, Cassini caught this final view of Earth between Saturn’s rings as the spacecraft spiraled in for its Grand Finale at Saturn.
‘Simply Stunning’

"The image is simply stunning. The image of the Earth evokes the famous 'Blue Marble' image taken by astronaut Harrison Schmitt during Apollo 17...which also showed Africa prominently in the picture." -Noah Petro, Deputy Project Scientist for our Lunar Reconnaissance Orbiter mission.
Goodbye—for now—at 19,000 mph

As part of an engineering test, our OSIRIS-REx spacecraft captured this image of Earth and the Moon in January 2018 from a distance of 39.5 million miles (63.6 million kilometers). When the camera acquired the image, the spacecraft was moving away from our home planet at a speed of 19,000 miles per hour (8.5 kilometers per second). Earth is the largest, brightest spot in the center of the image, with the smaller, dimmer Moon appearing to the right. Several constellations are also visible in the surrounding space.
The View from Mars

A human observer with normal vision, standing on Mars, could easily see Earth and the Moon as two distinct, bright "evening stars."
Moon Photobomb

"This image from the Deep Space Climate Observatory (DSCOVR) satellite captured a unique view of the Moon as it moved in front of the sunlit side of Earth in 2015. It provides a view of the far side of the Moon, which is never directly visible to us here on Earth. “I found this perspective profoundly moving and only through our satellite views could this have been shared.” - Michael Freilich, Director of our Earth Science Division.
Eight Days Out

Eight days after its final encounter with Earth—the second of two gravitational assists from Earth that helped boost the spacecraft to Jupiter—the Galileo spacecraft looked back and captured this remarkable view of our planet and its Moon. The image was taken from a distance of about 3.9 million miles (6.2 million kilometers).
A Slice of Life

Earth from about 393,000 miles (633,000 kilometers) away, as seen by the European Space Agency’s comet-bound Rosetta spacecraft during its third and final swingby of our home planet in 2009.
So Long Earth

The Mercury-bound MESSENGER spacecraft captured several stunning images of Earth during a gravity assist swingby of our home planet on Aug. 2, 2005.
Earth Science: Taking a Closer Look

Our home planet is a beautiful, dynamic place. Our view from Earth orbit sees a planet at change. Check out more images of our beautiful Earth here.
Join Our Earth Day Celebration!
We pioneer and supports an amazing range of advanced technologies and tools to help scientists and environmental specialists better understand and protect our home planet - from space lasers to virtual reality, small satellites and smartphone apps.
To celebrate Earth Day 2018, April 22, we are highlighting many of these innovative technologies and the amazing applications behind them.
Learn more about our Earth Day plans HERE.
Make sure to follow us on Tumblr for your regular dose of space: http://nasa.tumblr.com
The Hunt for New Worlds Continues with TESS
We're getting ready to start our next mission to find new worlds! The Transiting Exoplanet Survey Satellite (TESS) will find thousands of planets beyond our solar system for us to study in more detail. It's preparing to launch from our Kennedy Space Center at Cape Canaveral in Florida.

Once it launches, TESS will look for new planets that orbit bright stars relatively close to Earth. We're expecting to find giant planets, like Jupiter, but we're also predicting we'll find Earth-sized planets. Most of those planets will be within 300 light-years of Earth, which will make follow-up studies easier for other observatories.

TESS will find these new exoplanets by looking for their transits. A transit is a temporary dip in a star's brightness that happens with predictable timing when a planet crosses between us and the star. The information we get from transits can tell us about the size of the planet relative to the size of its star. We've found nearly 3,000 planets using the transit method, many with our Kepler space telescope. That's over 75% of all the exoplanets we've found so far!

TESS will look at nearly the entire sky (about 85%) over two years. The mission divides the sky into 26 sectors. TESS will look at 13 of them in the southern sky during its first year before scanning the northern sky the year after.

What makes TESS different from the other planet-hunting missions that have come before it? The Kepler mission (yellow) looked continually at one small patch of sky, spotting dim stars and their planets that are between 300 and 3,000 light-years away. TESS (blue) will look at almost the whole sky in sections, finding bright stars and their planets that are between 30 and 300 light-years away.

TESS will also have a brand new kind of orbit (visualized below). Once it reaches its final trajectory, TESS will finish one pass around Earth every 13.7 days (blue), which is half the time it takes for the Moon (gray) to orbit. This position maximizes the amount of time TESS can stare at each sector, and the satellite will transmit its data back to us each time its orbit takes it closest to Earth (orange).

Kepler's goal was to figure out how common Earth-size planets might be. TESS's mission is to find exoplanets around bright, nearby stars so future missions, like our James Webb Space Telescope, and ground-based observatories can learn what they're made of and potentially even study their atmospheres. TESS will provide a catalog of thousands of new subjects for us to learn about and explore.

The TESS mission is led by MIT and came together with the help of many different partners. Learn more about TESS and how it will further our knowledge of exoplanets, or check out some more awesome images and videos of the spacecraft. And stay tuned for more exciting TESS news as the spacecraft launches!
Watch the Launch!
*April 16 Update*
Launch teams are standing down today to conduct additional Guidance Navigation and Control analysis, and teams are now working towards a targeted launch of the Transiting Exoplanet Survey Satellite (TESS) on Wednesday, April 18. The TESS spacecraft is in excellent health, and remains ready for launch. TESS will launch on a Falcon 9 rocket from Space Launch Complex 40 at Cape Canaveral Air Force Station in Florida.
For more information and updates, visit: https://blogs.nasa.gov/tess/
Live Launch Coverage!
TESS is now slated to launch on Wednesday, April 18 on a SpaceX Falcon 9 rocket from our Kennedy Space Center in Florida.
Watch HERE.
Make sure to follow us on Tumblr for your regular dose of space: http://nasa.tumblr.com
A Tour of our Moon
Want to go to the Moon?
Let our Lunar Reconnaissance Orbiter take you there!

Our lunar orbiter, also known as LRO, has been collecting data on lunar topography, temperature, resources, solar radiation, and geology since it launched nine years ago. Our latest collection of this data is now in 4K resolution. This updated "Tour of the Moon" takes you on a virtual tour of our nearest neighbor in space, with new science updates from the vastly expanded data trove.
Orientale Basin

First stop, Orientale Basin located on the rim of the western nearside. It's about the size of Texas and is the best-preserved impact structure on the Moon. Topography data from LRO combined with gravity measurements from our twin GRAIL spacecraft reveal the structure below the surface and help us understand the geologic consequences of large impacts.
South-Pole and Shackleton Crater

Unlike Earth, the Moon's axis is barely tilted relative to the Sun. This means that there are craters at the poles where the sunlight never reaches, called permanently shadowed regions. As a result, the Moon's South Pole has some of the coldest measured places in the solar system. How cold? -410 degrees F.
Because these craters are so cold and dark, water that happens to find its way into them never has the opportunity to evaporate. Several of the instruments on LRO have found evidence of water ice, which you can see in the highlighted spots in this visualization.
South-Pole Aitken Basin

South Pole-Aitken Basin is the Moon's largest, deepest and oldest observed impact structure. Its diameter is about 2,200 km or 1,367 miles across and takes up 1/4 of the Moon! If there was a flat, straight road and you were driving 60 mph, it would take you about 22 hours to drive across. And the basin is so deep that nearly two Mount Everests stacked on each other would fit from the bottom of the basin to the rim. South-Pole Aitken Basin is a top choice for a landing site on the far side of the Moon.
Tycho Crater

Now let's go to the near side. Tycho Crater is 100 million years young. Yes, that's young in geologic time. The central peak of the impact crater likely formed from material that rebounded back up after being compressed in the impact, almost like a spring. Check out that boulder on top. It looks small in this image, but it could fill a baseball stadium.
Aristarchus Plateau

Also prominent on the nearside is the Aristarchus Plateau. It features a crater so bright that you could see it with your naked eye from Earth! The Aristarchus Plateau is particularly interesting to our scientists because it reveals much of the Moon's volcanic history. The region is covered in rocks from volcanic eruptions and the large river-like structure is actually a channel made from a long-ago lava flow.
Apollo 17 Landing Site
As much as we study the Moon looking for sites to visit, we also look back at places we've already been. This is because the new data that LRO is gathering helps us reinterpret the geology of familiar places, giving scientists a better understanding of the sequence of events in early lunar history.
Here, we descend to the Apollo 17 landing site in the Taurus-Littrow valley, which is deeper than the Grand Canyon. The LRO camera is even able to capture a view of the bottom half of the Apollo 17 Lunar Lander, which still sits on the surface, as well as the rover vehicle. These images help preserve our accomplishment of human exploration on the Moon's surface.
North Pole

Finally, we reach the North Pole. Like the South Pole, there are areas that are in permanent shadow and others that bask in nearly perpetual light. LRO scientists have taken detailed brightness and terrain measurements of the North Pole in order to model these areas of sunlight and shadow through time. Sunlit peaks and crater rims here may be ideal locations for generating solar power for future expeditions to the Moon.
LRO was designed as a one-year mission. Now in its ninth year, the spacecraft and the data emphasize the power of long-term data collection. Thanks to its many orbits around the Moon, we have been able to expand on lunar science from the Apollo missions while paving the way for future lunar exploration. And as the mission continues to gather data, it will provide us with many more opportunities to take a tour of our Moon.
And HERE's the full “Tour of the Moon” video:
We hope you enjoyed the tour. If you'd like to explore the moon further, please visit moon.nasa.gov and moontrek.jpl.nasa.gov.
Make sure to follow @NASAMoon on Twitter for the latest lunar updates and photos.
Make sure to follow us on Tumblr for your regular dose of space: http://nasa.tumblr.com
Ten Observations From Our Flying Telescope

SOFIA is a Boeing 747SP aircraft with a 100-inch telescope used to study the solar system and beyond by observing infrared light that can’t reach Earth’s surface.

What is infrared light? It’s light we cannot see with our eyes that is just beyond the red portion of visible light we see in a rainbow. It can be used to change your TV channels, which is how remote controls work, and it can tell us how hot things are.

Everything emits infrared radiation, even really cold objects like ice and newly forming stars! We use infrared light to study the life cycle of stars, the area around black holes, and to analyze the chemical fingerprints of complex molecules in space and in the atmospheres of other planets – including Pluto and Mars.

Above, is the highest-resolution image of the ring of dust and clouds around the back hole at the center of our Milky Way Galaxy. The bright Y-shaped feature is believed to be material falling from the ring into the black hole – which is located where the arms of the Y intersect.

The magnetic field in the galaxy M82 (pictured above) aligns with the dramatic flow of material driven by a burst of star formation. This is helping us learn how star formation shapes magnetic fields of an entire galaxy.

A nearby planetary system around the star Epsilon Eridani, the location of the fictional Babylon 5 space station, is similar to our own: it’s the closest known planetary system around a star like our sun and it also has an asteroid belt adjacent to the orbit of its largest, Jupiter-sized planet.

Observations of a supernova that exploded 10,000 years ago, that revealed it contains enough dust to make 7,000 Earth-sized planets!

Measurements of Pluto’s upper atmosphere, made just two weeks before our New Horizons spacecraft’s Pluto flyby. Combining these observations with those from the spacecraft are helping us understand the dwarf planet’s atmosphere.

A gluttonous star that has eaten the equivalent of 18 Jupiters in the last 80 years, which may change the theory of how stars and planets form.

Molecules like those in your burnt breakfast toast may offer clues to the building blocks of life. Scientists hypothesize that the growth of complex organic molecules like these is one of the steps leading to the emergence of life.

This map of carbon molecules in Orion’s Horsehead nebula (overlaid on an image of the nebula from the Palomar Sky Survey) is helping us understand how the earliest generations of stars formed. Our instruments on SOFIA use 14 detectors simultaneously, letting us make this map faster than ever before!
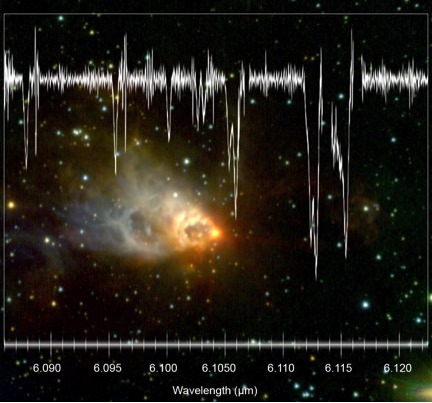
Pinpointing the location of water vapor in a newly forming star with groundbreaking precision. This is expanding our understanding of the distribution of water in the universe and its eventual incorporation into planets. The water vapor data from SOFIA is shown above laid over an image from the Gemini Observatory.

We captured the chemical fingerprints that revealed celestial clouds collapsing to form young stars like our sun. It’s very rare to directly observe this collapse in motion because it happens so quickly. One of the places where the collapse was observed is shown in this image from The Two Micron All Sky Survey.
Learn more by following SOFIA on Facebook, Twitter and Instagram.
Make sure to follow us on Tumblr for your regular dose of space: http://nasa.tumblr.com
What's Made in a Thunderstorm and Faster Than Lightning? Gamma Rays!
A flash of lightning. A roll of thunder. These are normal stormy sights and sounds. But sometimes, up above the clouds, stranger things happen. Our Fermi Gamma-ray Space Telescope has spotted bursts of gamma rays - some of the highest-energy forms of light in the universe - coming from thunderstorms. Gamma rays are usually found coming from objects with crazy extreme physics like neutron stars and black holes.
So why is Fermi seeing them come from thunderstorms?

Thunderstorms form when warm, damp air near the ground starts to rise and encounters colder air. As the warm air rises, moisture condenses into water droplets. The upward-moving water droplets bump into downward-moving ice crystals, stripping off electrons and creating a static charge in the cloud.

The top of the storm becomes positively charged, and the bottom becomes negatively charged, like two ends of a battery. Eventually the opposite charges build enough to overcome the insulating properties of the surrounding air - and zap! You get lightning.

Scientists suspect that lightning reconfigures the cloud's electrical field. In some cases this allows electrons to rush toward the upper part of the storm at nearly the speed of light. That makes thunderstorms the most powerful natural particle accelerators on Earth!

When those electrons run into air molecules, they emit a terrestrial gamma-ray flash, which means that thunderstorms are creating some of the highest energy forms of light in the universe. But that's not all - thunderstorms can also produce antimatter! Yep, you read that correctly! Sometimes, a gamma ray will run into an atom and produce an electron and a positron, which is an electron's antimatter opposite!

The Fermi Gamma-ray Space Telescope can spot terrestrial gamma-ray flashes within 500 miles of the location directly below the spacecraft. It does this using an instrument called the Gamma-ray Burst Monitor which is primarily used to watch for spectacular flashes of gamma rays coming from the universe.

There are an estimated 1,800 thunderstorms occurring on Earth at any given moment. Over the 10 years that Fermi has been in space, it has spotted about 5,000 terrestrial gamma-ray flashes. But scientists estimate that there are 1,000 of these flashes every day - we're just seeing the ones that are within 500 miles of Fermi's regular orbits, which don't cover the U.S. or Europe.
The map above shows all the flashes Fermi has seen since 2008. (Notice there's a blob missing over the lower part of South America. That's the South Atlantic Anomaly, a portion of the sky where radiation affects spacecraft and causes data glitches.)

Fermi has also spotted terrestrial gamma-ray flashes coming from individual tropical weather systems. The most productive system we've seen was Tropical Storm Julio in 2014, which later became a hurricane. It produced four flashes in just 100 minutes!

Learn more about what Fermi's discovered about gamma rays over the last 10 years and how we're celebrating its accomplishments.
Make sure to follow us on Tumblr for your regular dose of space: http://nasa.tumblr.com.
Solar System: 10 Things to Know
All About Ice
1. Earth's Changing Cryosphere

This year, we will launch two satellite missions that will increase our understanding of Earth's frozen reaches. Snow, ice sheets, glaciers, sea ice and permafrost, known as the cryosphere, act as Earth's thermostat and deep freeze, regulating temperatures by reflecting heat from the Sun and storing most of our fresh water.
2. GRACE-FO: Building on a Legacy and Forging Ahead

The next Earth science satellites set to launch are twins! The identical satellites of the GRACE Follow-On mission will build on the legacy of their predecessor GRACE by also tracking the ever-changing movement of water around our planet, including Earth's frozen regions. GRACE-FO, a partnership between us and the German Research Center for Geosciences (GFZ), will provide critical information about how the Greenland and Antarctic ice sheets are changing. GRACE-FO, working together, will measure the distance between the two satellites to within 1 micron (much less than the width of a human hair) to determine the mass below.

Greenland has been losing about 280 gigatons of ice per year on average, and Antarctica has lost almost 120 gigatons a year with indications that both melt rates are increasing. A single gigaton of water would fill about 400,000 Olympic-sized swimming pools; each gigaton represents a billion tons of water.
3. ICESat-2: 10,000 Laser Pulses a Second

In September, we will launch ICESat-2, which uses a laser instrument to precisely measure the changing elevation of ice around the world, allowing scientists to see whether ice sheets and glaciers are accumulating snow and ice or getting thinner over time. ICESat-2 will also make critical measurements of the thickness of sea ice from space. Its laser instrument sends 10,000 pulses per second to the surface and will measure the photons' return trip to satellite. The trip from ICESat-2 to Earth and back takes about 3.3 milliseconds.
4. Seeing Less Sea Ice

Summertime sea ice in the Arctic Ocean now routinely covers about 40% less area than it did in the late 1970s, when continuous satellite observations began. This kind of significant change could increase the rate of warming already in progress and affect global weather patterns.
5. The Snow We Drink

In the western United States, 1 in 6 people rely on snowpack for water. Our field campaigns such as the Airborne Snow Observatory and SnowEx seek to better understand how much water is held in Earth's snow cover, and how we could ultimately measure this comprehensively from space.
6. Hidden in the Ground

Permafrost - permanently frozen ground in the Arctic that contains stores of heat-trapping gases such as methane and carbon dioxide - is thawing at faster rates than previously observed. Recent studies suggest that within three to four decades, this thawing could be releasing enough greenhouse gases to make Arctic permafrost a net source of carbon dioxide rather than a sink. Through airborne and field research on missions such as CARVE and ABoVE - the latter of which will put scientists back in the field in Alaska and Canada this summer - our scientists are trying to improve measurements of this trend in order to better predict global impact.
7. Breaking Records Over Cracking Ice

Last year was a record-breaking one for Operation IceBridge, our aerial survey of polar ice. For the first time in its nine-year history, the mission carried out seven field campaigns in the Arctic and Antarctic in a single year. In total, the IceBridge scientists and instruments flew over 214,000 miles, the equivalent of orbiting the Earth 8.6 times at the equator.

On March 22, we completed the first IceBridge flight of its spring Arctic campaign with a survey of sea ice north of Greenland. This year marks the 10th Arctic spring campaign for IceBridge. The flights continue until April 27 extending the mission's decade-long mapping of the fastest-changing areas of the Greenland Ice Sheet and measuring sea ice thickness across the western Arctic basin.
8. OMG

Researchers were back in the field this month in Greenland with our Oceans Melting Greenland survey. The airborne and ship-based mission studies the ocean's role in melting Greenland's ice. Researchers examine temperatures, salinity and other properties of North Atlantic waters along the more than 27,000 miles (44,000 km) of jagged coastline.
9. DIY Glacier Modeling

Computer models are critical tools for understanding the future of a changing planet, including melting ice and rising seas. Our new sea level simulator lets you bury Alaska's Columbia glacier in snow, and, year by year, watch how it responds. Or you can melt the Greenland and Antarctic ice sheets and trace rising seas as they inundate the Florida coast.
10. Ice Beyond Earth

Ice is common in our solar system. From ice packed into comets that cruise the solar system to polar ice caps on Mars to Europa and Enceladus-the icy ocean moons of Jupiter and Saturn-water ice is a crucial ingredient in the search for life was we know it beyond Earth.
Read the full version of this week’s 10 Things to Know HERE.
Make sure to follow us on Tumblr for your regular dose of space: http://nasa.tumblr.com.
Jupiter's Great Red Spot Getting Taller as it Shrinks
Discover how a team of our scientists has uncovered evidence that Jupiter’s Great Red Spot is growing taller as it gets smaller.
Though once big enough to swallow three Earths with room to spare, Jupiter's Great Red Spot has been shrinking for a century and a half. Nobody is sure how long the storm will continue to contract or whether it will disappear altogether.

A new study suggests that it hasn't all been downhill, though. The storm seems to have increased in area at least once along the way, and it's growing taller as it gets smaller.

Observations of Jupiter date back centuries, but the first confirmed sighting of the Great Red Spot was in 1831. But until then, researchers aren't certain whether earlier observers who saw a red spot on Jupiter were looking at the same storm.

Amy Simon, an expert in planetary atmospheres at our Goddard Space Flight Center in Greenbelt, Maryland, and her team traced the evolution of the Great Red Spot, analyzing its size, shape, color and drift rate. They also looked at the storm's internal wind speeds, when that information was available from spacecraft.

This new study confirms that the storm has been decreasing in diameter overall since 1878 and is now big enough to accommodate just over one Earth at this point. Then again, the historical record indicates the area of the spot grew temporarily in the 1920s. Scientists aren't sure why it grew for a bit.

Because the storm has been contracting, the researchers expected to find the already-powerful internal winds becoming even stronger, like an ice skater who spins faster as she pulls in her arms.

But that's not what is happening. Instead of spinning faster, the storm appears to be forced to stretch up. It's almost like clay being shaped on a potter's wheel. As the wheel spins, an artist can transform a short, round lump into a tall, thin vase by pushing inward with his hands. The smaller he makes the base, the taller the vessel will grow.

The Great Red Spot's color has been deepening, too, becoming is a more intense orange color since 2014. Researchers aren't sure why that's happening, but it's possible that the chemicals coloring the storm are being carried higher into the atmosphere as the spot stretches up. At higher altitudes, the chemicals would be subjected to more UV radiation and would take on a deeper color.

In some ways, the mystery of the Great Red Spot only seems to deepen as the iconic storm gets smaller. Researchers don't know whether the spot will shrink a bit more and then stabilize, or break apart completely.
For more information, go here/watch this:
For the full story, click HERE.
Make sure to follow us on Tumblr for your regular dose of space: http://nasa.tumblr.com.
Solar System: 10 Things to Know This Week
Planets Outside Our Solar System
Let the planet-hunting begin!
Our Transiting Exoplanet Survey Satellite (TESS), which will scan the skies to look for planets beyond our solar system—known as exoplanets—is now in Florida to begin preparations for launch in April. Below, 10 Things to know about the many, many unknown planets out there awaiting our discovery.
1—Exo-what?

We call planets in our solar system, well, planets, but the many planets we’re starting to discover outside of our solar system are called exoplanets. Basically, they’re planets that orbit another star.
2—All eyes on TRAPPIST-1.

Remember the major 2016 announcement that we had discovered seven planets 40 light-years away, orbiting a star called TRAPPIST-1? Those are all exoplanets. (Here’s a refresher.)
3—Add 95 new ones to that.

Just last month, our Kepler telescope discovered 95 new exoplanets beyond our solar system (on top of the thousands of exoplanets Kepler has discovered so far). The total known planet count beyond our solar system is now more than 3,700. The planets range in size from mostly rocky super-Earths and fluffy mini-Neptunes, to Jupiter-like giants. They include a new planet orbiting a very bright star—the brightest star ever discovered by Kepler to have a transiting planet.
4—Here comes TESS.

How many more exoplanets are out there waiting to be discovered? TESS will monitor more than 200,000 of the nearest and brightest stars in search of transit events—periodic dips in a star’s brightness caused by planets passing in front—and is expected to find thousands of exoplanets.
5—With a sidekick, too.

Our upcoming James Webb Space Telescope, will provide important follow-up observations of some of the most promising TESS-discovered exoplanets. It will also allow scientists to study their atmospheres and, in some special cases, search for signs that these planets could support life.
6—Prepped for launch.

TESS is scheduled to launch on a SpaceX Falcon 9 rocket from Cape Canaveral Air Force Station nearby our Kennedy Space Center in Florida, no earlier than April 16, pending range approval.
7—A groundbreaking find.

In 1995, 51 Pegasi b (also called "Dimidium") was the first exoplanet discovered orbiting a star like our Sun. This find confirmed that planets like the ones in our solar system could exist elsewhere in the universe.
8—Trillions await.

A recent statistical estimate places, on average, at least one planet around every star in the galaxy. That means there could be a trillion planets in our galaxy alone, many of them in the range of Earth’s size.
9—Signs of life.

Of course, our ultimate science goal is to find unmistakable signs of current life. How soon can that happen? It depends on two unknowns: the prevalence of life in the galaxy and a bit of luck. Read more about the search for life.
10—Want to explore the galaxy?

No need to be an astronaut. Take a trip outside our solar system with help from our Exoplanet Travel Bureau.
Read the full version of this week’s ‘10 Things to Know’ article HERE.
Make sure to follow us on Tumblr for your regular dose of space: http://nasa.tumblr.com.
10 Ways to Celebrate Pi Day with Us on March 14
On March 14, we will join people across the U.S. as they celebrate an icon of nerd culture: the number pi.
So well known and beloved is pi, also written π or 3.14, that it has a national holiday named in its honor. And it’s not just for mathematicians and rocket scientists. National Pi Day is widely celebrated among students, teachers and science fans, too. Read on to find out what makes pi so special, how it’s used to explore space and how you can join the celebration with resources from our collection.

1—Remind me, what is pi?
Pi, also written π, is the Swiss Army knife of numbers. No matter how big or small a circle – from the size of our universe all the way down to an atom or smaller – the ratio of a circle’s circumference (the distance around it) to its diameter (the distance across it) is always equal to pi. Most commonly, pi is used to answer questions about anything circular or spherical, so it comes in handy especially when you’re dealing with space exploration.

2—How much pi do you need?
For simplicity, pi is often rounded to 3.14, but its digits go on forever and don’t appear to have any repeating patterns. While people have made it a challenge to memorize record-breaking digits of pi or create computer programs to calculate them, you really don’t need that many digits for most calculations – even at NASA. Here’s one of our engineers on how many decimals of pi you need.

3—Officially official.
Pi pops up in everything from rocket-science-level math to the stuff you learn in elementary school, so it’s gained a sort of cult following. On March 14 (or 3/14 in U.S. date format) in 1988, a physicist at the San Francisco Exploratorium held what is thought to be the first official Pi Day celebration, which smartly included the consumption of fruit pies. Math teachers quickly realized the potential benefits of teaching students about pi while they ate pie, and it all caught on so much that in 2009, the U.S. Congress officially declared March 14 National Pi Day. Here’s how to turn your celebration into a teachable moment.

4—Pi helps us explore space!
Space is full of circular and spherical features, and to explore them, engineers at NASA build spacecraft that make elliptical orbits and guzzle fuel from cylindrical fuel tanks, and measure distances on circular wheels. Beyond measurements and space travel, pi is used to find out what planets are made of and how deep alien oceans are, and to study newly discovered worlds. In other words, pi goes a long way at NASA.

5—Not just for rocket scientists.
No Pi Day is complete without a little problem solving. Even the math-averse will find something to love about this illustrated math challenge that features real questions scientists and engineers must answer to explore and study space – like how to determine the size of a distant planet you can’t actually see. Four new problems are added to the challenge each year and answers are released the day after Pi Day.

6—Teachers rejoice.
For teachers, the question is not whether to celebrate Pi Day, but how to celebrate it. (And how much pie is too much? Answer: The limit does not exist.) Luckily, our Education Office has an online catalog for teachers with all 20 of its “Pi in the Sky” math challenge questions for grades 4-12. Each lesson includes a description of the real-world science and engineering behind the problem, an illustrated handout and answer key, and a list of applicable Common Core Math and Next Generation Science Standards.

7—How Do We celebrate?
In a way, we celebrate Pi Day every day by using pi to explore space. But in our free time, we’ve been known to make and eat space-themed pies, too! Share your own nerdy celebrations with us here.

8—A pop-culture icon.
The fascination with pi, as well its popularity and accessibility have made it a go-to math reference in books, movies and television. Ellie, the protagonist in Carl Sagan’s book “Contact,” finds a hidden message from aliens in the digits of pi. In the original “Star Trek” series, Spock commanded an alien entity that had taken over the computer to compute pi to the last digit – an impossible task given that the digits of pi are infinite. And writers of “The Simpsons,” a show known for referencing math, created an episode in which Apu claims to know pi to 40,000 digits and proves it by stating that the 40,000th digit is 1.

9—A numbers game.
Calculating record digits of pi has been a pastime of mathematicians for millennia. Until the 1900s, these calculations were done by hand and reached records in the 500s. Once computers came onto the scene, that number jumped into the thousands, millions and now trillions. Scientist and pi enthusiast Peter Trueb holds the current record – 22,459,157,718,361 digits – which took his homemade computer 105 days of around-the-clock number crunching to achieve. The record for the other favorite pastime of pi enthusiasts, memorizing digits of pi, stands at 70,030.

10—Time to throw in the tau?
As passionate as people are about pi, there are some who believe things would be a whole lot better if we replaced pi with a number called tau, which is equal to 2π or 6.28. Because many formulas call for 2π, tau-enthusiasts say tau would provide a more elegant and efficient way to express those formulas. Every year on Pi Day, a small debate ensues. While we won’t take sides, we will say that pi is more widely used at NASA because it has applications far beyond geometry, where 2π is found most often. Perhaps most important, though, for pi- and pie-lovers alike is there’s no delicious homonym for tau.
Enjoy the full version of this article HERE.
Make sure to follow us on Tumblr for your regular dose of space: http://nasa.tumblr.com.
What's Inside SOFIA? High Flying Instruments

Our flying observatory, called SOFIA, carries a 100-inch telescope inside a Boeing 747SP aircraft. Having an airborne observatory provides many benefits.

It flies at 38,000-45,000 feet – above 99% of the water vapor in Earth’s atmosphere that blocks infrared light from reaching the ground!

It is also mobile! We can fly to the best vantage point for viewing the cosmos. We go to Christchurch, New Zealand, nearly every year to study objects best observed from the Southern Hemisphere. And last year we went to Daytona Beach, FL, to study the atmosphere of Neptune’s moon Triton while flying over the Atlantic Ocean.

SOFIA’s telescope has a large primary mirror – about the same size as the Hubble Space Telescope’s mirror. Large telescopes let us gather a lot of light to make high-resolution images!

But unlike a space-based observatory, SOFIA returns to our base every morning.

Which means that we can change the instruments we use to analyze the light from the telescope to make many different types of scientific observations. We currently have seven instruments, and new ones are now being developed to incorporate new technologies.
So what is inside SOFIA? The existing instruments include:

Infrared cameras that can peer inside celestial clouds of dust and gas to see stars forming inside. They can also study molecules in a nebula that may offer clues to the building blocks of life…

…A polarimeter, a device that measures the alignment of incoming light waves, that we use to study magnetic fields. The left image reveals that hot dust in the starburst galaxy M82 is magnetically aligned with the gas flowing out of it, shown in blue on the right image from our Chandra X-ray Observatory. This can help us understand how magnetic fields affect how stars form.

…A tracking camera that we used to study New Horizon’s post-Pluto flyby target and found that it may have its own moon…

…A spectrograph that spreads light into its component colors. We’re using one to search for signs of water plumes on Jupiter’s icy moon Europa and to search for signs of water on Venus to learn about how it lost its oceans…

…An instrument that studies high energy terahertz radiation with 14 detectors. It’s so efficient that we made this map of Orion’s Horsehead Nebula in only four hours! The map is made of 100 separate views of the nebula, each mapping carbon atoms at different velocities.

…And we have an instrument under construction that will soon let us study how water vapor, ice and oxygen combine at different times during planet formation, to better understand how these elements combine with dust to form a mass that can become a planet.

Our airborne telescope has already revealed so much about the universe around us! Now we’re looking for the next idea to help us use SOFIA in even more new ways.
Discover more about our SOFIA flying observatory HERE.
Make sure to follow us on Tumblr for your regular dose of space: http://nasa.tumblr.com.
Solar System: 10 Things to Know This Week
Week of March 5: Great Shots Inspiring views of our solar system and beyond
1-Mars-By-Numbers

“The first TV image of Mars, hand colored strip-by-strip, from Mariner 4 in 1965. The completed image was framed and presented to JPL director, William H. Pickering. Truly a labor of love for science!” -Kristen Erickson, NASA Science Engagement and Partnerships Director
2-Night Life

“There are so many stories to this image. It is a global image, but relates to an individual in one glance. There are stories on social, economic, population, energy, pollution, human migration, technology meets science, enable global information, etc., that we can all communicate with similar interests under one image.” -Winnie Humberson, NASA Earth Science Outreach Manager
3-Pale Blue Dot

“Whenever I see this picture, I wonder...if another species saw this blue dot what would they say and would they want to discover what goes on there...which is both good and bad. However, it would not make a difference within the eternity of space—we’re so insignificant...in essence just dust in the galactic wind—one day gone forever.”
-Dwayne Brown, NASA Senior Communications Official
4-Grand Central

“I observed the Galactic Center with several X-ray telescopes before Chandra, including the Einstein Observatory and ROSAT. But the Chandra image looks nothing like those earlier images, and it reminded me how complex the universe really is. Also I love the colors.” -Paul Hertz, Director, NASA Astrophysics Division
5-Far Side Photobomb

“This image from the Deep Space Climate Observatory (DSCOVR) satellite captured a unique view of the Moon as it moved in front of the sunlit side of Earth in 2015. It shows a view of the farside of the Moon, which faces the Sun, that is never directly visible to us here on Earth. I found this perspective profoundly moving and only through our satellite views could this have been shared.” -Michael Freilich, Director NASA Earth Science Division
6-”Shocking, Exciting and Wonderful”

“Pluto was so unlike anything I could imagine based on my knowledge of the Solar System. It showed me how much about the outer solar system we didn’t know. Truly shocking, exciting and wonderful all at the same time.” -Jim Green, Director, NASA Planetary Science Division
7-Slices of the Sun

“This is an awesome image of the Sun through the Solar Dynamic Observatory’s many filters. It is one of my favorites.” - Peg Luce, Director, NASA Heliophysics Division (Acting)
8-Pluto’s Cold, Cold Heart

“This high-resolution, false color image of Pluto is my favorite. The New Horizons flyby of Pluto on July 14, 2015 capped humanity’s initial reconnaissance of every major body in the solar system. To think that all of this happened within our lifetime! It’s a reminder of how privileged we are to be alive and working at NASA during this historic era of space exploration.” - Laurie Cantillo, NASA Planetary Science Public Affairs Officer
9-Family Portrait

“The Solar System family portrait, because it is a symbol what NASA exploration is really about: Seeing our world in a new and bigger way.” - Thomas H. Zurbuchen, Associate Administrator, NASA Science Mission Directorate
10-Share Your Favorite Space Shots

Tag @NASASolarSystem on your favorite social media platform with a link to your favorite image and few words about why it makes your heart thump.
Check out the full version of this article HERE.
Make sure to follow us on Tumblr for your regular dose of space: http://nasa.tumblr.com.
The Universe's Brightest Lights Have Some Dark Origins
Did you know some of the brightest sources of light in the sky come from black holes in the centers of galaxies? It sounds a little contradictory, but it's true! They may not look bright to our eyes, but satellites have spotted oodles of them across the universe.
One of those satellites is our Fermi Gamma-ray Space Telescope. Fermi has found thousands of these kinds of galaxies in the 10 years it's been operating, and there are many more out there!

Black holes are regions of space that have so much gravity that nothing - not light, not particles, nada - can escape. Most galaxies have supermassive black holes at their centers - these are black holes that are hundreds of thousands to billions of times the mass of our sun - but active galactic nuclei (also called "AGN" for short, or just "active galaxies") are surrounded by gas and dust that's constantly falling into the black hole. As the gas and dust fall, they start to spin and form a disk. Because of the friction and other forces at work, the spinning disk starts to heat up.

The disk's heat gets emitted as light - but not just wavelengths of it that we can see with our eyes. We see light from AGN across the entire electromagnetic spectrum, from the more familiar radio and optical waves through to the more exotic X-rays and gamma rays, which we need special telescopes to spot.

About one in 10 AGN beam out jets of energetic particles, which are traveling almost as fast as light. Scientists are studying these jets to try to understand how black holes - which pull everything in with their huge amounts of gravity - somehow provide the energy needed to propel the particles in these jets.

Many of the ways we tell one type of AGN from another depend on how they're oriented from our point of view. With radio galaxies, for example, we see the jets from the side as they're beaming vast amounts of energy into space. Then there's blazars, which are a type of AGN that have a jet that is pointed almost directly at Earth, which makes the AGN particularly bright.

Our Fermi Gamma-ray Space Telescope has been searching the sky for gamma ray sources for 10 years. More than half (57%) of the sources it has found have been blazars. Gamma rays are useful because they can tell us a lot about how particles accelerate and how they interact with their environment.

So why do we care about AGN? We know that some AGN formed early in the history of the universe. With their enormous power, they almost certainly affected how the universe changed over time. By discovering how AGN work, we can understand better how the universe came to be the way it is now.

Fermi's helped us learn a lot about the gamma-ray universe over the last 10 years. Learn more about Fermi and how we're celebrating its accomplishments all year.
Make sure to follow us on Tumblr for your regular dose of space: http://nasa.tumblr.com.
Solar System: 10 Things to Know This Week
Pioneer Days
Someone’s got to be first. In space, the first explorers beyond Mars were Pioneers 10 and 11, twin robots who charted the course to the cosmos.

1-Before Voyager

Voyager, with its outer solar system tour and interstellar observations, is often credited as the greatest robotic space mission. But today we remember the plucky Pioneers, the spacecraft that proved Voyager’s epic mission was possible.
2-Where No One Had Gone Before

Forty-five years ago this week, scientists still weren’t sure how hard it would be to navigate the main asteroid belt, a massive field of rocky debris between Mars and Jupiter. Pioneer 10 helped them work that out, emerging from first the first six-month crossing in February 1973. Pioneer 10 logged a few meteoroid hits (fewer than expected) and taught engineers new tricks for navigating farther and farther beyond Earth.
3-Trailblazer No. 2

Pioneer 11 was a backup spacecraft launched in 1973 after Pioneer 10 cleared the asteroid belt. The new mission provided a second close look at Jupiter, the first close-up views of Saturn and also gave Voyager engineers plotting an epic multi-planet tour of the outer planets a chance to practice the art of interplanetary navigation.
4-First to Jupiter

Three-hundred and sixty-three years after humankind first looked at Jupiter through a telescope, Pioneer 10 became the first human-made visitor to the Jovian system in December 1973. The spacecraft spacecraft snapped about 300 photos during a flyby that brought it within 81,000 miles (about 130,000 kilometers) of the giant planet’s cloud tops.
5-Pioneer Family

Pioneer began as a Moon program in the 1950s and evolved into increasingly more complicated spacecraft, including a Pioneer Venus mission that delivered a series of probes to explore deep into the mysterious toxic clouds of Venus. A family portrait (above) showing (from left to right) Pioneers 6-9, 10 and 11 and the Pioneer Venus Orbiter and Multiprobe series. Image date: March 11, 1982.
6-A Pioneer and a Pioneer

Classic rock has Van Halen, we have Van Allen. With credits from Explorer 1 to Pioneer 11, James Van Allen was a rock star in the emerging world of planetary exploration. Van Allen (1914-2006) is credited with the first scientific discovery in outer space and was a fixture in the Pioneer program. Van Allen was a key part of the team from the early attempts to explore the Moon (he’s pictured here with Pioneer 4) to the more evolved science platforms aboard Pioneers 10 and 11.
7-The Farthest...For a While

For more than 25 years, Pioneer 10 was the most distant human-made object, breaking records by crossing the asteroid belt, the orbit of Jupiter and eventually even the orbit of Pluto. Voyager 1, moving even faster, claimed the most distant title in February 1998 and still holds that crown.
8-Last Contact

We last heard from Pioneer 10 on Jan. 23, 2003. Engineers felt its power source was depleted and no further contact should be expected. We tried again in 2006, but had no luck. The last transmission from Pioneer 11 was received in September 1995. Both missions were planned to last about two years.
9-Galactic Ghost Ships

Pioneers 10 and 11 are two of five spacecraft with sufficient velocity to escape our solar system and travel into interstellar space. The other three—Voyagers 1 and 2 and New Horizons—are still actively talking to Earth. The twin Pioneers are now silent. Pioneer 10 is heading generally for the red star Aldebaran, which forms the eye of Taurus (The Bull). It will take Pioneer over 2 million years to reach it. Pioneer 11 is headed toward the constellation of Aquila (The Eagle) and will pass nearby in about 4 million years.
10-The Original Message to the Cosmos

Years before Voyager’s famed Golden Record, Pioneers 10 and 11 carried the original message from Earth to the cosmos. Like Voyager’s record, the Pioneer plaque was the brainchild of Carl Sagan who wanted any alien civilization who might encounter the craft to know who made it and how to contact them. The plaques give our location in the galaxy and depicts a man and woman drawn in relation to the spacecraft.
Read the full version of this week’s 10 Things article HERE.
Make sure to follow us on Tumblr for your regular dose of space: http://nasa.tumblr.com.

A magnetic power struggle of galactic proportions - new research highlights the role of the Sun’s magnetic landscape in the development of solar eruptions that can trigger space weather events around Earth.
Using data from our Solar Dynamics Observatory, scientists examined an October 2014 Jupiter-sized sunspot group, an area of complex magnetic fields, often the site of solar activity. This was the biggest group in the past two solar cycles and a highly active region. Though conditions seemed ripe for an eruption, the region never produced a major coronal mass ejection (CME) - a massive, bubble-shaped eruption of solar material and magnetic field - on its journey across the Sun. It did, however, emit a powerful X-class flare, the most intense class of flares. What determines, the scientists wondered, whether a flare is associated with a CME?
The scientists found that a magnetic cage physically prevented a CME from erupting that day. Just hours before the flare, the sunspot’s natural rotation contorted the magnetic rope and it grew increasingly twisted and unstable, like a tightly coiled rubber band.
Credits: Tahar Amari et al./Center for Theoretical Physics/École Polytechnique/NASA Goddard/Joy Ng
Make sure to follow us on Tumblr for your regular dose of space: http://nasa.tumblr.com.

During a recent close flyby of the gas giant Jupiter, our Juno spacecraft captured this stunning series of images showing swirling cloud patterns on the planet’s south pole. At first glance, the series might appear to be the same image repeated. But closer inspection reveals slight changes, which are most easily noticed by comparing the far-left image with the far-right image.
Directly, the images show Jupiter. But, through slight variations in the images, they indirectly capture the motion of the Juno spacecraft itself, once again swinging around a giant planet hundreds of millions of miles from Earth.
Juno captured this color-enhanced time-lapse sequence of images on Feb. 7 between 10:21 a.m. and 11:01 a.m. EST. At the time, the spacecraft was between 85,292 to 124,856 miles (137,264 to 200,937 kilometers) from the tops of the clouds of the planet with the images centered on latitudes from 84.1 to 75.5 degrees south.
Credit: NASA/JPL-Caltech/SwRI/MSSS/Gerald Eichstädt
Make sure to follow us on Tumblr for your regular dose of space: http://nasa.tumblr.com.
This animation blinks between two images of our Mars Phoenix Lander. The first – dark smudges on the planet’s surface. The second – the same Martian terrain nearly a decade later, covered in dust. Our Mars orbiter captured this shot as it surveyed the planet from orbit: the first in 2008. The second: late 2017.
In August 2008, Phoenix completed its three-month mission studying Martian ice, soil and atmosphere. The lander worked for two additional months before reduced sunlight caused energy to become insufficient to keep the lander functioning. The solar-powered robot was not designed to survive through the dark and cold conditions of a Martian arctic winter.
Read the full story HERE.
Credit: NASA/JPL-Caltech/Univ. of Arizona
Make sure to follow us on Tumblr for your regular dose of space: http://nasa.tumblr.com.
Help Explore Your Own Solar Neighborhood
We’re always making amazing discoveries about the farthest reaches of our universe, but there’s also plenty of unexplored territory much closer to home.

Our “Backyard Worlds: Planet 9” is a citizen science project that asks curious people like you — yes, you there! — to help us spot objects in the area around our own solar system like brown dwarfs. You could even help us figure out if our solar system hosts a mysterious Planet 9!

In 2009, we launched the Wide-field Infrared Survey Explorer (WISE). Infrared radiation is a form of light that humans can’t see, but WISE could. It scans the sky for infrared light, looking for galaxies, stars and asteroids. Later on, scientists started using it to search for near-Earth objects (NEOWISE) like comets and asteroids.

These searches have already turned up so much data that researchers have trouble hunting through all of it. They can’t do it on their own. That’s why we asked everyone to chip in. If you join Backyard Worlds: Planet 9, you’ll learn how to look at noisy images of space and spot previously unidentified objects.
You’ll figure out how to tell the difference between real objects, like planets and stars, and artifacts. Artifacts are blurry blobs of light that got scattered around in WISE’s instruments while it was looking at the sky. These “optical ghosts” sometimes look like real objects.

Why can’t we use computers to do this, you ask? Well, computers are good at lots of things, like crunching numbers. But when it comes to recognizing when something’s a ghostly artifact and when it’s a real object, humans beat software all the time. After some practice, you’ll be able to recognize which objects are real and which aren’t just by watching them move!

One of the things our citizen scientists look for are brown dwarfs, which are balls of gas too big to be planets and too small to be stars. These objects are some of our nearest neighbors, and scientists think there’s probably a bunch of them floating around nearby, we just haven’t been able to find all of them yet.
But since Backyard Worlds launched on February 15, 2016, our volunteers have spotted 432 candidate brown dwarfs. We’ve been able to follow up 20 of these with ground-based telescopes so far, and 17 have turned out to be real!

Image Credit: Ryan Trainor, Franklin and Marshall College
How do we know for sure that we’ve spotted actual, bona fide, authentic brown dwarfs? Well, like with any discovery in science, we followed up with more observation. Our team gets time on ground-based observatories like the InfraRed Telescope Facility in Hawaii, the Magellan Telescope in Chile (pictured above) and the Apache Point Observatory in New Mexico and takes a closer look at our candidates. And sure enough, our participants found 17 brown dwarfs!

But we’re not done! There’s still lots of data to go through. In particular, we want your help looking for a potential addition to our solar system’s census: Planet 9. Some scientists think it’s circling somewhere out there past Pluto. No one has seen anything yet, but it could be you! Or drop by and contribute to our other citizen science projects like Disk Detective.
Congratulations to the citizen scientists who spotted these 17 brown dwarfs: Dan Caselden, Rosa Castro, Guillaume Colin, Sam Deen, Bob Fletcher, Sam Goodman, Les Hamlet, Khasan Mokaev, Jörg Schümann and Tamara Stajic.
Make sure to follow us on Tumblr for your regular dose of space: http://nasa.tumblr.com.
Infrared is Beautiful
Why was James Webb Space Telescope designed to observe infrared light? How can its images hope to compare to those taken by the (primarily) visible-light Hubble Space Telescope? The short answer is that Webb will absolutely capture beautiful images of the universe, even if it won’t see exactly what Hubble sees. (Spoiler: It will see a lot of things even better.)

The James Webb Space Telescope, or Webb, is our upcoming infrared space observatory, which will launch in 2019. It will spy the first luminous objects that formed in the universe and shed light on how galaxies evolve, how stars and planetary systems are born, and how life could form on other planets.
What is infrared light?
This may surprise you, but your remote control uses light waves just beyond the visible spectrum of light—infrared light waves—to change channels on your TV.
Infrared light shows us how hot things are. It can also show us how cold things are. But it all has to do with heat. Since the primary source of infrared radiation is heat or thermal radiation, any object that has a temperature radiates in the infrared. Even objects that we think of as being very cold, such as an ice cube, emit infrared.
There are legitimate scientific reasons for Webb to be an infrared telescope. There are things we want to know more about, and we need an infrared telescope to learn about them. Things like: stars and planets being born inside clouds of dust and gas; the very first stars and galaxies, which are so far away the light they emit has been stretched into the infrared; and the chemical fingerprints of elements and molecules in the atmospheres of exoplanets, some of which are only seen in the infrared.
In a star-forming region of space called the 'Pillars of Creation,' this is what we see with visible light:

And this is what we see with infrared light:

Infrared light can pierce through obscuring dust and gas and unveil a more unfamiliar view.
Webb will see some visible light: red and orange. But the truth is that even though Webb sees mostly infrared light, it will still take beautiful images. The beauty and quality of an astronomical image depends on two things: the sharpness of the image and the number of pixels in the camera. On both of these counts, Webb is very similar to, and in many ways better than, Hubble. Webb will take much sharper images than Hubble at infrared wavelengths, and Hubble has comparable resolution at the visible wavelengths that Webb can see.

Webb’s infrared data can be translated by computer into something our eyes can appreciate – in fact, this is what we do with Hubble data. The gorgeous images we see from Hubble don’t pop out of the telescope looking fully formed. To maximize the resolution of the images, Hubble takes multiple exposures through different color filters on its cameras.
The separate exposures, which look black and white, are assembled into a true color picture via image processing. Full color is important to image analysis of celestial objects. It can be used to highlight the glow of various elements in a nebula, or different stellar populations in a galaxy. It can also highlight interesting features of the object that might be overlooked in a black and white exposure, and so the images not only look beautiful but also contain a lot of useful scientific information about the structure, temperatures, and chemical makeup of a celestial object.
This image shows the sequences in the production of a Hubble image of nebula Messier 17:

Here’s another compelling argument for having telescopes that view the universe outside the spectrum of visible light – not everything in the universe emits visible light. There are many phenomena which can only be seen at certain wavelengths of light, for example, in the X-ray part of the spectrum, or in the ultraviolet. When we combine images taken at different wavelengths of light, we can get a better understanding of an object, because each wavelength can show us a different feature or facet of it.
Just like infrared data can be made into something meaningful to human eyes, so can each of the other wavelengths of light, even X-rays and gamma-rays.
Below is an image of the M82 galaxy created using X-ray data from the Chandra X-ray Observatory, infrared data from the Spitzer Space Telescope, and visible light data from Hubble. Also note how aesthetically pleasing the image is despite it not being just optical light:

Though Hubble sees primarily visible light, it can see some infrared. And despite not being optimized for it, and being much less powerful than Webb, it still produced this stunning image of the Horsehead Nebula.

It’s a big universe out there – more than our eyes can see. But with all the telescopes now at our disposal (as well as the new ones that will be coming online in the future), we are slowly building a more accurate picture. And it’s definitely a beautiful one. Just take a look...
…At this Spitzer infrared image of a shock wave in dust around the star Zeta Ophiuchi.

…this Spitzer image of the Helix Nebula, created using infrared data from the telescope and ultraviolet data from the Galaxy Evolution Explorer.

…this image of the “wing” of the Small Magellanic Cloud, created with infrared data from Spitzer and X-ray data from Chandra.

...the below image of the Milky Way’s galactic center, taken with our flying SOFIA telescope. It flies at more than 40,000 feet, putting it above 99% of the water vapor in Earth's atmosphere-- critical for observing infrared because water vapor blocks infrared light from reaching the ground. This infrared view reveals the ring of gas and dust around a supermassive black hole that can't be seen with visible light.

…and this Hubble image of the Mystic Mountains in the Carina Nebula.

Learn more about the James Webb Space Telescope HERE, or follow the mission on Facebook, Twitter and Instagram.
Image Credits Eagle Nebula: NASA, ESA/Hubble and the Hubble Heritage Team Hubble Image Processing - Messier 17: NASA/STScI Galaxy M82 Composite Image: NASA, CXC, JHU, D.Strickland, JPL-Caltech, C. Engelbracht (University of Arizona), ESA, and The Hubble Heritage Team (STScI/AURA) Horsehead Nebula: NASA, ESA, and The Hubble Heritage Team (STScI/AURA) Zeta Ophiuchi: NASA/JPL-Caltech Helix Nebula: NASA/JPL-Caltech Wing of the Small Magellanic Cloud X-ray: NASA/CXC/Univ.Potsdam/L.Oskinova et al; Optical: NASA/STScI; Infrared: NASA/JPL-Caltech Milky Way Circumnuclear Ring: NASA/DLR/USRA/DSI/FORCAST Team/ Lau et al. 2013 Mystic Mountains in the Carina Nebula: NASA/ESA/M. Livio & Hubble 20th Anniversary Team (STScI)
Make sure to follow us on Tumblr for your regular dose of space: http://nasa.tumblr.com.
Get Ready to Watch Us Go for GOLD
The boundary where Earth’s atmosphere gives way to outer space is a complex place: Atmospheric waves driven by weather on Earth compete with electric and magnetic fields that push charged particles, all while our signals and satellites whiz by.

On Jan. 25, we’re launching the GOLD instrument (short for Global-scale Observations of the Limb and Disk) to get an exciting new birds-eye view of this region, Earth’s interface to space.

High above the ozone layer, the Sun’s intense radiation cooks some of the particles in the upper atmosphere into an electrically charged soup, where negatively charged electrons and positively charged ions flow freely. This is the ionosphere. The ionosphere is co-mingled with the highest reaches of our planet’s neutral upper atmosphere, called the thermosphere.
Spanning from just a few dozen to several hundred miles above Earth’s surface, the ionosphere is increasingly part of the human domain. Not only do our satellites, including the International Space Station, fly through this region, but so do the signals that are part of our communications and navigation systems, including GPS. Changes in this region can interfere with satellites and signals alike.

Conditions in the upper atmosphere are difficult to predict, though. Intense weather, like hurricanes, can cause atmospheric waves to propagate all the way up to this region, creating winds that change its very makeup.

Because it’s made up of electrically charged particles, the upper atmosphere also responds to space weather. Space weather – which is usually driven by activity on the Sun – often results in electric and magnetic fields that push and pull on the ionosphere’s charged particles, changing the region’s makeup. On top of that, space weather can also mean incoming showers of high-energy particles that can affect satellites or endanger astronauts, and, in extreme cases, even cause power outages on Earth.

That’s where GOLD comes in. GOLD takes advantage of its host satellite’s geostationary orbit over the Western Hemisphere to maintain a constant view of the upper atmosphere, day and night. By scanning across, GOLD builds up a complete picture of Earth’s disk every half hour.

GOLD is an imaging spectrograph, a type of instrument that breaks light down into its component wavelengths. Studying light in this way lets scientists track the movement and temperatures of different chemical species and build up a picture of how the upper atmosphere changes over time. Capturing these measurements several times a day means that, for the first time, scientists will be able to record the short-term changes in the region -- our first look at its day-to-day ‘weather.’

GOLD is our first-ever mission to fly as a hosted payload on a commercial satellite. A hosted payload flies aboard an otherwise unrelated satellite, hitching a ride to space. GOLD studies the upper atmosphere, while its host satellite supports commercial communications.
Later this year, we’re launching another mission to study the ionosphere: ICON, short for Ionospheric Connection Explorer. Like GOLD, ICON studies Earth’s interface to space, but with a few important distinctions. ICON employs a suite of different instruments to study the ionosphere both remotely and in situ. The direct in situ measurements are possible because ICON flies in low-Earth orbit, giving us a detailed view to complement GOLD’s global perspective of the regions that both missions study.

How to watch the launch on Jan. 25
Arianespace, a commerical aerospace company, is launching GOLD’s host commercial communications satellite, SES-14, for SES from Kourou, French Guiana.
Watch liftoff live on NASA Television - nasa.gov/live Launch Coverage starts at 5 p.m. EST (2 p.m. PST, 7 p.m. Kourou local time)
We’ll be streaming the launch live on NASA TV! You can also follow along on Twitter (@NASA and @NASASun), Facebook (NASA and NASA Sun Science), Instagram, and on our Snapchat (NASA).
Make sure to follow us on Tumblr for your regular dose of space: http://nasa.tumblr.com.
The Beauty of Webb Telescope’s Mirrors
The James Webb Space Telescope’s gold-plated, beryllium mirrors are beautiful feats of engineering. From the 18 hexagonal primary mirror segments, to the perfectly circular secondary mirror, and even the slightly trapezoidal tertiary mirror and the intricate fine-steering mirror, each reflector went through a rigorous refinement process before it was ready to mount on the telescope. This flawless formation process was critical for Webb, which will use the mirrors to peer far back in time to capture the light from the first stars and galaxies.

The James Webb Space Telescope, or Webb, is our upcoming infrared space observatory, which will launch in 2019. It will spy the first luminous objects that formed in the universe and shed light on how galaxies evolve, how stars and planetary systems are born, and how life could form on other planets.
A polish and shine that would make your car jealous

All of the Webb telescope’s mirrors were polished to accuracies of approximately one millionth of an inch. The beryllium mirrors were polished at room temperature with slight imperfections, so as they change shape ever so slightly while cooling to their operating temperatures in space, they achieve their perfect shape for operations.

The Midas touch
Engineers used a process called vacuum vapor deposition to coat Webb’s mirrors with an ultra-thin layer of gold. Each mirror only required about 3 grams (about 0.11 ounces) of gold. It only took about a golf ball-sized amount of gold to paint the entire main mirror!

Before the deposition process began, engineers had to be absolutely sure the mirror surfaces were free from contaminants.

The engineers thoroughly wiped down each mirror, then checked it in low light conditions to ensure there was no residue on the surface.

Inside the vacuum deposition chamber, the tiny amount of gold is turned into a vapor and deposited to cover the entire surface of each mirror.

Primary, secondary, and tertiary mirrors, oh my!
Each of Webb’s primary mirror segments is hexagonally shaped. The entire 6.5-meter (21.3-foot) primary mirror is slightly curved (concave), so each approximately 1.3-meter (4.3-foot) piece has a slight curve to it.

Those curves repeat themselves among the segments, so there are only three different shapes — 6 of each type. In the image below, those different shapes are labeled as A, B, and C.

Webb’s perfectly circular secondary mirror captures light from the 18 primary mirror segments and relays those images to the telescope's tertiary mirror.

The secondary mirror is convex, so the reflective surface bulges toward a light source. It looks much like a curved mirror that you see on the wall near the exit of a parking garage that lets motorists see around a corner.

Webb’s trapezoidal tertiary mirror captures light from the secondary mirror and relays it to the fine-steering mirror and science instruments. The tertiary mirror sits at the center of the telescope’s primary mirror. The tertiary mirror is the only fixed mirror in the system — all of the other mirrors align to it.

All of the mirrors working together will provide Webb with the most advanced infrared vision of any space observatory we’ve ever launched!
Who is the fairest of them all?
The beauty of Webb’s primary mirror was apparent as it rotated past a cleanroom observation window at our Goddard Space Flight Center in Greenbelt, Maryland. If you look closely in the reflection, you will see none other than James Webb Space Telescope senior project scientist and Nobel Laureate John Mather!

Learn more about the James Webb Space Telescope HERE, or follow the mission on Facebook, Twitter and Instagram.
Make sure to follow us on Tumblr for your regular dose of space: http://nasa.tumblr.com.
Solar System: 10 Things to Know This Week
January 8: Images for Your Computer or Phone Wallpaper
Need some fresh perspective? Here are 10 vision-stretching images for your computer desktop or phone wallpaper. These are all real pictures, sent recently by our planetary missions throughout the solar system. You'll find more of our images at solarsystem.nasa.gov/galleries, images.nasa.gov and www.jpl.nasa.gov/spaceimages.
Applying Wallpaper: 1. Click on the screen resolution you would like to use. 2. Right-click on the image (control-click on a Mac) and select the option 'Set the Background' or 'Set as Wallpaper' (or similar).
1. The Fault in Our Mars

This image from our Mars Reconnaissance Orbiter (MRO) of northern Meridiani Planum shows faults that have disrupted layered deposits. Some of the faults produced a clean break along the layers, displacing and offsetting individual beds.
Desktop: 1280 x 800 | 1600 x 1200 | 1920 x 1200 Mobile: 1440 x 2560 | 1080 x 1920 | 750 x 1334
2. Jupiter Blues

Our Juno spacecraft captured this image when the spacecraft was only 11,747 miles (18,906 kilometers) from the tops of Jupiter's clouds -- that's roughly as far as the distance between New York City and Perth, Australia. The color-enhanced image, which captures a cloud system in Jupiter's northern hemisphere, was taken on Oct. 24, 2017, when Juno was at a latitude of 57.57 degrees (nearly three-fifths of the way from Jupiter's equator to its north pole) and performing its ninth close flyby of the gas giant planet.
Desktop: 1280 x 800 | 1600 x 1200 | 1920 x 1200 Mobile: 1440 x 2560 | 1080 x 1920 | 750 x 1334
3. A Farewell to Saturn

After more than 13 years at Saturn, and with its fate sealed, our Cassini spacecraft bid farewell to the Saturnian system by firing the shutters of its wide-angle camera and capturing this last, full mosaic of Saturn and its rings two days before the spacecraft's dramatic plunge into the planet's atmosphere on Sept. 15, 2017.
Desktop: 1280 x 800 | 1600 x 1200 | 1920 x 1200 Mobile: 1440 x 2560 | 1080 x 1920 | 750 x 1334
4. All Aglow

Saturn's moon Enceladus drifts before the rings, which glow brightly in the sunlight. Beneath its icy exterior shell, Enceladus hides a global ocean of liquid water. Just visible at the moon's south pole (at bottom here) is the plume of water ice particles and other material that constantly spews from that ocean via fractures in the ice. The bright speck to the right of Enceladus is a distant star. This image was taken in visible light with the Cassini spacecraft narrow-angle camera on Nov. 6, 2011.
Desktop: 1280 x 800 | 1600 x 1200 | 1920 x 1200 Mobile: 1440 x 2560 | 1080 x 1920 | 750 x 1334
5. Rare Encircling Filament

Our Solar Dynamics Observatory came across an oddity this week that the spacecraft has rarely observed before: a dark filament encircling an active region (Oct. 29-31, 2017). Solar filaments are clouds of charged particles that float above the Sun, tethered to it by magnetic forces. They are usually elongated and uneven strands. Only a handful of times before have we seen one shaped like a circle. (The black area to the left of the brighter active region is a coronal hole, a magnetically open region of the Sun).
Desktop: 1280 x 800 | 1600 x 1200 | 1920 x 1200 Mobile: 1440 x 2560 | 1080 x 1920 | 750 x 1334
6. Jupiter's Stunning Southern Hemisphere

See Jupiter's southern hemisphere in beautiful detail in this image taken by our Juno spacecraft. The color-enhanced view captures one of the white ovals in the "String of Pearls," one of eight massive rotating storms at 40 degrees south latitude on the gas giant planet. The image was taken on Oct. 24, 2017, as Juno performed its ninth close flyby of Jupiter. At the time the image was taken, the spacecraft was 20,577 miles (33,115 kilometers) from the tops of the clouds of the planet.
Desktop: 1280 x 800 | 1600 x 1200 | 1920 x 1200 Mobile: 1440 x 2560 | 1080 x 1920 | 750 x 1334
7. Saturn's Rings: View from Beneath

Our Cassini spacecraft obtained this panoramic view of Saturn's rings on Sept. 9, 2017, just minutes after it passed through the ring plane. The view looks upward at the southern face of the rings from a vantage point above Saturn's southern hemisphere.
Desktop: 1280 x 800 | 1600 x 1200 | 1920 x 1200 Mobile: 1440 x 2560 | 1080 x 1920 | 750 x 1334
8. From Hot to Hottest

This sequence of images from our Solar Dynamics Observatory shows the Sun from its surface to its upper atmosphere all taken at about the same time (Oct. 27, 2017). The first shows the surface of the sun in filtered white light; the other seven images were taken in different wavelengths of extreme ultraviolet light. Note that each wavelength reveals somewhat different features. They are shown in order of temperature, from the first one at about 11,000 degrees Fahrenheit (6,000 degrees Celsius) on the surface, out to about 10 million degrees in the upper atmosphere. Yes, the sun's outer atmosphere is much, much hotter than the surface. Scientists are getting closer to solving the processes that generate this phenomenon.
Desktop: 1280 x 800 | 1600 x 1200 | 1920 x 1200 Mobile: 1440 x 2560 | 1080 x 1920 | 750 x 1334
9. High Resolution View of Ceres

This orthographic projection shows dwarf planet Ceres as seen by our Dawn spacecraft. The projection is centered on Occator Crater, home to the brightest area on Ceres. Occator is centered at 20 degrees north latitude, 239 degrees east longitude.
Desktop: 1280 x 800 | 1600 x 1200 | 1920 x 1200 Mobile: 1440 x 2560 | 1080 x 1920 | 750 x 1334
10. In the Chasm

This image from our Mars Reconnaissance Orbiter shows a small portion of the floor of Coprates Chasma, a large trough within the Valles Marineris system of canyons. Although the exact sequence of events that formed Coprates Chasma is unknown, the ripples, mesas, and craters visible throughout the terrain point to a complex history involving multiple mechanisms of erosion and deposition. The main trough of Coprates Chasma ranges from 37 miles (60 kilometers) to 62 miles (100 kilometers) in width.
Desktop: 1280 x 800 | 1600 x 1200 | 1920 x 1200 Mobile: 1440 x 2560 | 1080 x 1920 | 750 x 1334
Explore and learn more about our solar system at: solarsystem.nasa.gov/.
Make sure to follow us on Tumblr for your regular dose of space: http://nasa.tumblr.com.
Meet Fermi: Our Eyes on the Gamma-Ray Sky
Black holes, cosmic rays, neutron stars and even new kinds of physics — for 10 years, data from our Fermi Gamma-ray Space Telescope have helped unravel some of the biggest mysteries of the cosmos. And Fermi is far from finished!

On June 11, 2008, at Cape Canaveral in Florida, the countdown started for Fermi, which was called the Gamma-ray Large Area Space Telescope (GLAST) at the time.
The telescope was renamed after launch to honor Enrico Fermi, an Italian-American pioneer in high-energy physics who also helped develop the first nuclear reactor.
Fermi has had many other things named after him, like Fermi’s Paradox, the Fermi National Accelerator Laboratory, the Enrico Fermi Nuclear Generating Station, the Enrico Fermi Institute, and the synthetic element fermium.

Photo courtesy of Argonne National Laboratory
The Fermi telescope measures some of the highest energy bursts of light in the universe; watching the sky to help scientists answer all sorts of questions about some of the most powerful objects in the universe.
Its main instrument is the Large Area Telescope (LAT), which can view 20% of the sky at a time and makes a new image of the whole gamma-ray sky every three hours. Fermi’s other instrument is the Gamma-ray Burst Monitor. It sees even more of the sky at lower energies and is designed to detect brief flashes of gamma-rays from the cosmos and Earth.

This sky map below is from 2013 and shows all of the high energy gamma rays observed by the LAT during Fermi’s first five years in space. The bright glowing band along the map’s center is our own Milky Way galaxy!

So what are gamma rays?
Well, they’re a form of light. But light with so much energy and with such short wavelengths that we can’t see them with the naked eye. Gamma rays require a ton of energy to produce — from things like subatomic particles (such as protons) smashing into each other.
Here on Earth, you can get them in nuclear reactors and lightning strikes. Here’s a glimpse of the Seattle skyline if you could pop on a pair of gamma-ray goggles. That purple streak? That’s still the Milky Way, which is consistently the brightest source of gamma rays in our sky.

In space, you find that kind of energy in places like black holes and neutron stars. The raindrop-looking animation below shows a big flare of gamma rays that Fermi spotted coming from something called a blazar, which is a kind of quasar, which is different from a pulsar... actually, let’s back this up a little bit.

One of the sources of gamma rays that Fermi spots are pulsars. Pulsars are a kind of neutron star, which is a kind of star that used to be a lot bigger, but collapsed into something that’s smaller and a lot denser. Pulsars send out beams of gamma rays. But the thing about pulsars is that they rotate.
So Fermi only sees a beam of gamma rays from a pulsar when it’s pointed towards Earth. Kind of like how you only periodically see the beam from a lighthouse. These flashes of light are very regular. You could almost set your watch by them!

Quasars are supermassive black holes surrounded by disks of gas. As the gas falls into the black hole, it releases massive amount of energy, including — you guessed it — gamma rays. Blazars are quasars that send out beams of gamma rays and other forms of light — right in our direction.
When Fermi sees them, it’s basically looking straight down this tunnel of light, almost all the way back to the black hole. This means we can learn about the kinds of conditions in that environment when the rays were emitted. Fermi has found about 5,500 individual sources of gamma rays, and the bulk of them have been blazars, which is pretty nifty.

But gamma rays also have many other sources. We’ve seen them coming from supernovas where stars die and from star factories where stars are born. They’re created in lightning storms here on Earth, and our own Sun can toss them out in solar flares.
Gamma rays were in the news last year because of something Fermi spotted at almost the same time as the National Science Foundation (NSF)’s Laser Interferometer Gravitational-Wave Observatory (LIGO) and European Gravitational Observatory’s Virgo on August 17, 2017. Fermi, LIGO, Virgo, and numerous other observatories spotted the merger of two neutron stars. It was the first time that gravitational waves and light were confirmed to come from the same source.

Fermi has been looking at the sky for almost 10 years now, and it’s helped scientists advance our understanding of the universe in many ways. And the longer it looks, the more we’ll learn. Discover more about how we’ll be celebrating Fermi’s achievements all year.
Make sure to follow us on Tumblr for your regular dose of space: http://nasa.tumblr.com.
Going for GOLD
On Jan. 25, we’re going for GOLD!
We’re launching an instrument called Global-scale Observations of the Limb and Disk, GOLD for short. It’s a new mission that will study a complicated — and not yet fully understood — region of near-Earth space, called the ionosphere.

Space is not completely empty: It’s teeming with fast-moving energized particles and electric and magnetic fields that guide their motion. At the boundary between Earth’s atmosphere and space, these particles and fields — the ionosphere — co-exist with the upper reaches of the neutral atmosphere.

That makes this a complicated place. Big events in the lower atmosphere, like hurricanes or tsunamis, can create waves that travel all the way up to that interface to space, changing the wind patterns and causing disruptions.

It’s also affected by space weather. The Sun is a dynamic star, and it releases spurts of energized particles and blasts of solar material carrying electric and magnetic fields that travel out through the solar system. Depending on their direction, these bursts have the potential to disrupt space near Earth.

This combination of factors makes it hard to predict changes in the ionosphere — and that can have a big impact. Communications signals, like radio waves and signals that make our GPS systems work, travel through this region, and sudden changes can distort them or even cut them off completely.

Low-Earth orbiting satellites — including the International Space Station — also fly through the ionosphere, so understanding how it fluctuates is important for protecting these satellites and astronauts.

GOLD is a spectrograph, an instrument that breaks light down into its component wavelengths, measuring their intensities. Breaking light up like this helps scientists see the behavior of individual chemical elements — for instance, separating the amount of oxygen versus nitrogen. GOLD sees in far ultraviolet light, a type of light that’s invisible to our eyes.

GOLD is a hosted payload. The instrument is hitching a ride aboard SES-14, a commercial communications satellite built by Airbus for SES Government Solutions, which owns and operates the satellite.
Also launching this year is the Ionospheric Connection Explorer, or ICON, which will also study the ionosphere and neutral upper atmosphere. But while GOLD will fly in geostationary orbit some 22,000 miles above the Western Hemisphere, ICON will fly just 350 miles above Earth, able to gather close up images of this region.

Together, these missions give us an unprecedented look at the ionosphere and upper atmosphere, helping us understand the very nature of how our planet interacts with space.
To learn more about this region of space and the GOLD mission, visit: nasa.gov/gold.
Make sure to follow us on Tumblr for your regular dose of space: http://nasa.tumblr.com.
Are we alone in the universe?
There’s never been a better time to ponder this age-old question. We now know of thousands of exoplanets – planets that orbit stars elsewhere in the universe.

So just how many of these planets could support life?
Scientists from a variety of fields — including astrophysics, Earth science, heliophysics and planetary science — are working on this question. Here are a few of the strategies they’re using to learn more about the habitability of exoplanets.
Squinting at Earth
Even our best telescopic images of exoplanets are still only a few pixels in size. Just how much information can we extract from such limited data? That’s what Earth scientists have been trying to figure out.
One group of scientists has been taking high-resolution images of Earth from our Earth Polychromatic Imaging Camera and ‘degrading’ them in order to match the resolution of our pixelated exoplanet images. From there, they set about a grand process of reverse-engineering: They try to extract as much accurate information as they can from what seems — at first glance — to be a fairly uninformative image.

Credits: NOAA/NASA/DSCOVR
So far, by looking at how Earth’s brightness changes when land versus water is in view, scientists have been able to reverse-engineer Earth's albedo (the proportion of solar radiation it reflects), its obliquity (the tilt of its axis relative to its orbital plane), its rate of rotation, and even differences between the seasons. All of these factors could potentially influence a planet’s ability to support life.
Avoiding the “Venus Zone”
In life as in science, even bad examples can be instructive. When it comes to habitability, Venus is a bad example indeed: With an average surface temperature of 850 degrees Fahrenheit, an atmosphere filled with sulfuric acid, and surface pressure 90 times stronger than Earth’s, Venus is far from friendly to life as we know it.

The surface of Venus, imaged by Soviet spacecraft Venera 13 in March 1982
Since Earth and Venus are so close in size and yet so different in habitability, scientists are studying the signatures that distinguish Earth from Venus as a tool for differentiating habitable planets from their unfriendly look-alikes.
Using data from our Kepler Space Telescope, scientists are working to define the “Venus Zone,” an area where planetary insolation – the amount of light a given planet receives from its host star -- plays a key role in atmospheric erosion and greenhouse gas cycles.

Planets that appear similar to Earth, but are in the Venus Zone of their star, are, we think, unlikely to be able to support life.
Modeling Star-Planet Interactions
When you don’t know one variable in an equation, it can help to plug in a reasonable guess and see how things work out. Scientists used this process to study Proxima b, our closest exoplanet neighbor. We don’t yet know whether Proxima b, which orbits the red dwarf star Proxima Centauri four light-years away, has an atmosphere or a magnetic field like Earth’s. However, we can estimate what would happen if it did.
The scientists started by calculating the radiation emitted by Proxima Centauri based on observations from our Chandra X-ray Observatory. Given that amount of radiation, they estimated how much atmosphere Proxima b would be likely to lose due to ionospheric escape — a process in which the constant outpouring of charged stellar material strips away atmospheric gases.

With the extreme conditions likely to exist at Proxima b, the planet could lose the equivalent of Earth’s entire atmosphere in 100 million years — just a fraction of Proxima b’s 4-billion-year lifetime. Even in the best-case scenario, that much atmospheric mass escapes over 2 billion years. In other words, even if Proxima b did at one point have an atmosphere like Earth, it would likely be long gone by now.
Imagining Mars with a Different Star
We think Mars was once habitable, supporting water and an atmosphere like Earth’s. But over time, it gradually lost its atmosphere – in part because Mars, unlike Earth, doesn’t have a protective magnetic field, so Mars is exposed to much harsher radiation from the Sun's solar wind.

But as another rocky planet at the edge of our solar system’s habitable zone, Mars provides a useful model for a potentially habitable planet. Data from our Mars Atmosphere and Volatile Evolution, or MAVEN, mission is helping scientists answer the question: How would Mars have evolved if it were orbiting a different kind of star?
Scientists used computer simulations with data from MAVEN to model a Mars-like planet orbiting a hypothetical M-type red dwarf star. The habitable zone of such a star is much closer than the one around our Sun.

Being in the habitable zone that much closer to a star has repercussions. In this imaginary situation, the planet would receive about 5 to 10 times more ultraviolet radiation than the real Mars does, speeding up atmospheric escape to much higher rates and shortening the habitable period for the planet by a factor of about 5 to 20.
These results make clear just how delicate a balance needs to exist for life to flourish. But each of these methods provides a valuable new tool in the multi-faceted search for exoplanet life. Armed with these tools, and bringing to bear a diversity of scientific perspectives, we are better positioned than ever to ask: are we alone?
Make sure to follow us on Tumblr for your regular dose of space: http://nasa.tumblr.com.