Arctic - Blog Posts


@theshyesticicle is this who I think it is?! Is he back? Or am I just dumb lol


“Well, you know what they say! If it ain’t nailed down, it’s free!”
“…That’s… not what anyone says…”
“Oh, Trunks, your naivete is adorable~”
Name
Arctic
Age:
No one knows
Height:
About 5 ft 6
Occupation:
The Most Responsible and Lawful Citizen Ever
Thief, somehow also a hero
Sexuality:
Pansexual
Pronouns:
He/him
Backstory:
Arctic is Icicle’s uncle, the older brother of Icicle’s father. He was technically supposed to inherit the family business and wealth, but he was so flighty and unpredictable that it all skipped over to his little brother. He didn’t really care and spent his days gallivanting across the galaxy, stealing everything that isn’t nailed down. He’s not really the best thief… he got caught several times and had to book it, leaving behind most of his loot.
He briefly was forced by his sister-in-law to join the Frieza Force, but he got bored by all the responsibility and discipline and once again booked it. He rarely visited his family, mostly because he was afraid of them making him settle down.
Eventually he found himself summoned by a dragon and was suddenly in some weird city. He didn’t really pay attention to what this weird purple-haired guy was going on about, but he stuck around… because he had no clue how to leave Toki Toki City. Somehow this idiot managed to save the day and become the Toki Toki City Hero… although, the flightiest, least predictable hero they’d ever had. He stuck around after that purely because he has the biggest, most pathetic crush on Xenoverse Trunks ever.
Trunks often finds himself stopping Arctic several times a day to confiscate anything the icejin might have stolen from other Patrollers.
Personality:
Flighty, unpredictable. Steals everything that isn’t nailed down. Easily distracted. Will stop a conversation if he sees something shiny. Can be surprisingly blood thirsty for a guy who acts like an airhead most of the time. Would blow up a planet if it suited his purposes. Not exactly evil… he doesn’t go out of his way to hurt people, but he doesn’t exactly care about anyone who gets in the way of whatever he wants. Not careful at all. Lazy as hell. Trips over thin air. Chatty. Annoyingly cheerful. Lover of puns. Adores his little brother and only ever visited his family to see him. Not fond of children. Actually pretty friendly if he doesn’t feel threatened. Not particularly snobby… likes other races, unlike most of his species. Super laid-back and just goes with the flow. Honestly kind of dumb.

Wolf the icewing. Character for my story and one of minor villains. He is a hunter who uses his weapon to take down his enemies from a distance. Where he got his gun it is one of the mysteries in the story (which will take place some years after books), protagonists going to solve. And they encounter many strange things...

"It's too cold for pirates"
Silly Kwazii, it's not that cold.
I was mimicking an art style of a really good book I read as a kid. If you recognize the book then you'll understand the style.


A ref commission for the lovely @/ArcticWolf622 on twitter, thank you so much again!
How Climate Change Showed Up in 2021
2021 was tied for the sixth-hottest year since modern record keeping began. We work together with the National Oceanic and Atmospheric Administration to track temperatures around the world and study how they change from year to year.

For decades, the overall global temperature has been increasing because of human activities. The last decade has been the warmest on record. Each individual year’s average temperature, however, can be affected by things like ocean circulation, volcanic eruptions, and specific weather events.
For instance, last year we saw the beginning of La Niña – a pattern of cooler waters in the Pacific – that was responsible for slightly cooling 2021’s average temperature. Still, last year continued a long-term trend of global warming.
Globally, Earth’s temperature in 2021 was nearly 2°F warmer than the late 19th Century, for the seventh year in a row.

The Record
Studying 142 Years
Since 1880, we can put together a consistent record of temperatures around the planet and see that it was much colder in the late-19th century. Before 1880, uncertainties in tracking global temperatures are larger. Temperatures have increased even faster since the 1970s, the result of increasing greenhouse gases in the atmosphere.
Tracking Millions of Individual Observations
Our scientists use millions of individual observations of data from more than 20,000 weather stations and Antarctic research stations, together with ship- and buoy-based observations of sea surface temperatures, to track global temperatures.

Reviewing Multiple Independent Records
Our global temperature record – GISTEMP – is one of a number of independent global temperature records, all of which show the same pattern of warming.

The Consequences
Everywhere Experiences Climate Change Differently
As Earth warms, temperature changes occur unevenly around the globe. The Arctic is currently warming about four times faster than the rest of the planet – a process called Arctic amplification. Similarly, urban areas tend to warm faster than rural areas, partly because building materials like asphalt, steel and concrete retain heat.

Droughts and Floods in Warmer Weather
More than 88% of the Western US experienced drought conditions in 2021. At the same time, communities in Western Europe saw two months’ worth of rain in 24 hours, breaking records and triggering flash floods. Because a hotter climate means more water can be carried in the atmosphere, areas like the Western US suffer drought from the increased 'thirstiness' of the atmosphere, while precipitation events can become more extreme as the amount of moisture in the atmosphere rises.

Sea Levels Continue to Rise
Melting ice raises sea levels around the world, as meltwater drains into the ocean. In addition, heat causes the ocean water to expand. From 1993 to today, global mean sea level has been rising around 3.4 millimeters per year. In 2021, sea level data from the recently launched NASA/ESA Sentinel-6 Michael Freilich mission became available to the public.

There is Hope
“This is not good news, but the fact that we are able to track this in real time and understand why it’s changing, and get people to notice why it’s changing and how we can change things to change the next trajectory, that gives me hope. Because we’re not in the dark here. We’re not the dinosaurs who are unaware the comet is coming. We can see the comet coming, and we can act.” – Dr. Gavin Schmidt, director of NASA GISS, where the global temperature record is calculated
Make sure to follow us on Tumblr for your regular dose of space!
One Hot Year after Another
Globally, 2020 was the hottest year on record, effectively tying 2016, the previous record. Overall, Earth’s average temperature has risen more than 2 degrees Fahrenheit since the 1880s.

Temperatures are increasing due to human activities, specifically emissions of greenhouse gases, like carbon dioxide and methane.
Heat and the energy it carries are what drive our planet: winds, weather, droughts, floods, and more are expressions of heat. The right amount of heat is even one of the things that makes life on Earth possible. But too much heat is changing the way our planet’s systems act.
My World’s on Fire
Higher temperatures drive longer, more intense fire seasons. As rain and snowfall patterns change, some regions are getting drier and more vulnerable to damage, setting the stage for more fires.

2020 saw several record-breaking fires, both in Australia in the beginning of the year, and in the western U.S. through northern summer and fall. Smoke from fires in both regions reached so high into the atmosphere that it formed clouds and continues to travel around the globe today.

In the Siberian Arctic, unusually high temperatures helped drive at least 19 fires in the region. More than half of them were burning peat soil -- decomposed organic materials -- that stores a lot of carbon. Peat fires release vast amounts of carbon into the atmosphere, potentially leading to even more warming.

The Water’s Getting Warm
It wasn’t just fire seasons setting records. 2020 had more named tropical storms in the Atlantic and more storms making landfall in the U.S. than any hurricane season on record.

Hurricanes rely on warm ocean water as fuel, and this year, the Atlantic provided. 30 named storms weren’t the only things that made this year’s hurricane season notable.

Storms like Eta, Delta, and Iota quickly changed from smaller, weaker tropical storms into more destructive hurricanes. This rapid intensification is complicated, but it’s likely that warmer, more humid weather -- a result of climate change -- helps drive it.

The Ice Is Getting Thin
Add enough heat, and even the biggest chunk of ice will melt. That’s true whether we’re talking about the ice cubes in your glass or the vast sheets of ice at our planet’s poles. Right now, the Arctic region is warming about three times faster than the rest of our planet, which has some major effects both locally and globally.

This year, Arctic sea ice hit a near-record low. Sea ice is actually made of frozen ocean water, and it grows and thaws with the seasons, typically reaching an annual minimum extent in September.

Warmer ocean water led to more ice melting this year, and 2020’s annual minimum extent continued a long trend of shrinking Arctic sea ice extent.
A Long Trend
We study Earth and how it’s changing from the ground, the sky, and space. Using data from sensors all around the planet, we calculate the global average temperature, working with our partners at NOAA.
Many other organizations also track global temperature using their own instruments and methods, and they all match remarkably well. The last seven years were the hottest seven years on record. Earth is getting warmer.

We also study the effects of increasing temperatures, like the melting sea ice and longer fire seasons mentioned above. Additionally, we can study the cause of climate change from space, with a bird’s eye view of increasing carbon in the atmosphere.

The planet is changing because of human activities. We’re working together with other agencies to monitor changes and understand what this means for people in the future.
Make sure to follow us on Tumblr for your regular dose of space: http://nasa.tumblr.com.
Moving at the Speed of Arctic Ice
Time-lapses taken from space can help track how Earth’s polar regions are changing, watching as glaciers retreat and accelerate, and ice sheets melt over decades.

Using our long data record and a new computer program, we can watch Alaskan glaciers shift and flow every year since 1972. Columbia Glacier, which was relatively stable in the 1970s, has since retreated rapidly as the climate continues to warm.

The Malaspina Glacier has pulsed and spread and pulsed again. The flashes and imperfect frames in these time-lapses result from the need for cloud-free images from each year, and the technology limitations of the early generation satellites.

In Greenland, glaciers are also reacting to the warming climate. Glaciers are essentially frozen rivers, flowing across land. As they get warmer, they flow faster and lose more ice to the ocean. On average, glaciers in Greenland have retreated about 3 miles between 1985 and 2018. The amount of ice loss was fairly consistent for the first 15 years of the record, but started increasing around 2000.

Warmer temperatures also affect Greenland farther inland, where the surface of ice sheets and glaciers melts, forming lakes that can be up to 3 miles across. Over the last 20 years, the number of meltwater lakes forming in Greenland increased 27% and appeared at higher elevations, where temperatures were previously too cold for melt.

Whether they're studying how ice flows into the water, or how water pools atop ice, scientists are investigating some of the many aspects of how climate affects Earth's polar regions.
For more information, visit climate.nasa.gov.
Make sure to follow us on Tumblr for your regular dose of space: http://nasa.tumblr.com.
Perfect 10: A Decade of Studying Ice from the Sky
From 2009 through 2019, our Operation IceBridge flew planes above the Arctic, Antarctic and Alaska, measuring the height, depth, thickness, flow and change of sea ice, glaciers and ice sheets.

IceBridge was designed to “bridge” the years between NASA’s two Ice, Cloud, and land Elevation Satellites, ICESat and ICESat-2. IceBridge made its final polar flight in November 2019, one year after ICESat-2’s successful launch.
A lot of amazing science happens in a decade of fundamentally changing the way we see ice. Here, in chronological order, are 10 of IceBridge’s most significant and exciting achievements.
2009: Go for launch

The first ICESat monitored ice, clouds, atmospheric particles and vegetation globally beginning in 2003. As ICESat neared the end of its life, we made plans to keep measuring ice elevation with aircraft until ICESat-2’s launch.
ICESat finished its service in August 2009, leaving IceBridge in charge of polar ice tracking for the next decade.
2009: Snow on sea ice

To measure how thick sea ice is, we first have to know how much snow is accumulated on top of the ice. Using a snow radar instrument, IceBridge gathered the first widespread data set of snow thickness on top of both Arctic and Antarctic sea ice.
2009: Getting to the bottom of glaciers

IceBridge mapped hundreds of miles of grounding lines in both Antarctica and Greenland. Grounding lines are where a glacier’s bottom loses contact with the bedrock and begins floating on seawater – a grounding line that is higher than rock that the ice behind it is resting on increases the possibility of glaciers retreating in the future.
The team mapped 200 glaciers along Greenland’s coastal areas, as well as coastal areas, the interior of the Greenland Ice Sheet and high-priority areas in Antarctica.
2011: Spotting cracks in the ice

While flying Antarctica in 2011, IceBridge scientists spotted a massive crack in Pine Island Glacier, one of the fastest-changing glaciers on the continent. The crack produced a new iceberg that October.
Pine Island has grown thinner and more unstable in recent decades, spawning new icebergs almost every year. IceBridge watched for cracks that could lead to icebergs and mapped features like the deep water channel underneath Pine Island Glacier, which may bring warm water to its underside and make it melt faster.
2013: Making a map of rock

Using surface elevation, ice thickness and bedrock topography data from ICESat, IceBridge and international partners, the British Antarctic Survey created an updated map of the bedrock beneath Antarctic ice.
Taking gravity and magnetic measurements helps scientists understand what kind of rock lies below the ice sheet. Soft rock and meltwater make ice flow faster, while hard rock makes it harder for the ice to flow quickly.
2013: Surprises under the ice

IceBridge’s airborne radar data helped map the bedrock underneath the Greenland Ice Sheet, revealing a previously unknown canyon more than 400 miles long and up to a half mile deep slicing through the northern half of the country.
The “grand canyon” of Greenland may have once been a river system, and today likely transports meltwater from Greenland’s interior to the Arctic Ocean.
2015: It’s what’s inside (the ice sheet) that counts

After mapping the bedrock under the Greenland Ice Sheet, scientists turned their attention to the middle layers of the ice. Using both ice-penetrating radar and ice samples taken in the field, IceBridge created the first map of the ice sheet’s many layers, formed as thousands of years of snow became compacted downward and formed ice.
Making the 3D map of Greenland’s ice layers gave us clues as to how the ice sheet has warmed in the past, and where it may be frozen to bedrock or slowly melting instead.
2018: Gap bridged!

ICESat-2 launched on September 15, 2018, rocketing IceBridge into the final phase of its mission: Connecting ICESat and ICESat-2.
IceBridge continued flying after ICESat-2’s launch, working to verify the new satellite’s measurements. By conducting precise underflights, where planes traced the satellite’s orbit lines and took the same measurements at nearly the same time, the science teams could compare results and make sure ICESat-2’s instruments were functioning properly.
2018: An impact crater under the ice

Using IceBridge data, an international team of scientists found an impact crater from a meteor thousands of years in the past. The crater is larger than the city of Washington, D.C., likely created by a meteor more than half a mile wide.
2019: Flying into the sunset

In 2019, IceBridge continued flying in support of ICESat-2 for its Arctic and Antarctic campaigns. The hundreds of terabytes of data the team collected over the decade will fuel science for years to come.
IceBridge finished its last polar flight on November 20, 2019. The team will complete one more set of Alaska flights in 2020.
Make sure to follow us on Tumblr for your regular dose of space: http://nasa.tumblr.com
Polar Vortex spills Arctic weather into North America

What in the world is a polar vortex? On Earth, it’s a large area of low pressure and extremely cold air that usually swirls over the Arctic, with strong counter-clockwise winds that trap the cold around the Pole. But disturbances in the jet stream and the intrusion of warmer mid-latitude air masses can disturb this polar vortex and make it unstable, sending Arctic air south into middle latitudes.
That has been the case in late January 2019 as frigid weather moves across the Midwest and Northern Plains of the United States, as well as interior Canada. Forecasters are predicting that air temperatures in parts of the continental United States will drop to their lowest levels since at least 1994, with the potential to break all-time record lows for January 30 and 31. With clear skies, steady winds, and snow cover on the ground, as many as 90 million Americans could experience temperatures at or below 0 degrees Fahrenheit (-18° Celsius), according to the National Weather Service (NWS).
The Goddard Earth Observing System Model above shows this air temperature movement at 2 meters (around 6.5 feet above the ground) from January 23-29. You can see some portions of the Arctic are close to the freezing point—significantly warmer than usual for the dark of mid-winter—while masses of cooler air plunge toward the interior of North America.

Science Behind the Polar Vortex / Credit: NOAA
Meteorologists predicted that steady northwest winds (10 to 20 miles per hour) were likely to add to the misery, causing dangerous wind chills below -40°F (-40°C) in portions of 12 states. A wind chill of -20°F can cause frostbite in as little as 30 minutes, according to the weather service.
Not sure how cold that is? Check out the low temperatures on January 30, 2019 in some of the coldest places on Earth—and a planetary neighbor:
-46°F (-43°C) -- Chesterfield, Newfoundland
-36°F (-33°C) -- Yukon Territory, Canada
-33°F (-27°C) -- Fargo, North Dakota (Within the Polar Vortex)
-28°F (-18°C) -- Minneapolis, Minnesota (Within the Polar Vortex)
-27°F (-33°C) -- Amundsen-Scott South Pole Station, Antarctica
-24°F (-31°C) -- Chicago, Illinois (Within the Polar Vortex)
-15°F (5°C) -- Barrow, Alaska
-99°F (-73°C) -- Mars
Learn more about the science behind the polar vortex and how NASA is modeling it here: https://go.nasa.gov/2Wtmb43.
Make sure to follow us on Tumblr for your regular dose of space: http://nasa.tumblr.com
Extreme Science: Launching Sounding Rockets from The Arctic
This winter, our scientists and engineers traveled to the world's northernmost civilian town to launch rockets equipped with cutting-edge scientific instruments.

This is the beginning of a 14-month-long campaign to study a particular region of Earth's magnetic field — which means launching near the poles. What's it like to launch a science rocket in these extreme conditions?

Our planet is protected by a natural magnetic field that deflects most of the particles that flow out from the Sun — the solar wind — away from our atmosphere. But near the north and south poles, two oddities in Earth's magnetic field funnel these solar particles directly into our atmosphere. These regions are the polar cusps, and it turns out they're the ideal spot for studying how our atmosphere interacts with space.

The scientists of the Grand Challenge Initiative — Cusp are using sounding rockets to do their research. Sounding rockets are suborbital rockets that launch to a few hundred miles in altitude, spending a few minutes in space before falling back to Earth. That means sounding rockets can carry sensitive instruments above our atmosphere to study the Sun, other stars and even distant galaxies.
They also fly directly through some of the most interesting regions of Earth's atmosphere, and that's what scientists are taking advantage of for their Grand Challenge experiments.

One of the ideal rocket ranges for cusp science is in Ny-Ålesund, Svalbard, off the coast of Norway and within the Arctic circle. Because of its far northward position, each morning Svalbard passes directly under Earth's magnetic cusp.
But launching in this extreme, remote environment puts another set of challenges on the mission teams. These launches need to happen during the winter, when Svalbard experiences 24/7 darkness because of Earth's axial tilt. The launch teams can go months without seeing the Sun.

Like for all rocket launches, the science teams have to wait for the right weather conditions to launch. Because they're studying upper atmospheric processes, some of these teams also have to wait for other science conditions, like active auroras. Auroras are created when charged particles collide with Earth’s atmosphere — often triggered by solar storms or changes in the solar wind — and they're related to many of the upper-atmospheric processes that scientists want to study near the magnetic cusp.

But even before launch, the extreme conditions make launching rockets a tricky business — it's so cold that the rockets must be encased in styrofoam before launch to protect them from the low temperatures and potential precipitation.

When all is finally ready, an alarm sounds throughout the town of Ny-Ålesund to alert residents to the impending launch. And then it's up, up and away! This photo shows the launch of the twin VISIONS-2 sounding rockets on Dec. 7, 2018 from Ny-Ålesund.

These rockets are designed to break up during flight — so after launch comes clean-up. The launch teams track where debris lands so that they can retrieve the pieces later.

The next launch of the Grand Challenge Initiative is AZURE, launching from Andøya Space Center in Norway in March 2019.
For even more about what it's like to launch science rockets in extreme conditions, check out one scientist's notes from the field: https://go.nasa.gov/2QzyjR4

For updates on the Grand Challenge Initiative and other sounding rocket flights, visit nasa.gov/soundingrockets or follow along with NASA Wallops and NASA heliophysics on Twitter and Facebook.
@NASA_Wallops | NASA’s Wallops Flight Facility | @NASASun | NASA Sun Science
Uncovering a Massive Meteor Crater Found Lurking Under the Ice

For the first time ever, we've found a massive crater hiding under one of Earth's ice sheets. Likely caused by a meteor, it was uncovered in Greenland by a team of international scientists using radar data.

The data was collected by missions like our Operation IceBridge, which flies planes over Greenland and Antarctica to study the ice and snow at our planet’s poles.

In this case, the crater is near Hiawatha Glacier, covered by a sheet of ice more than half a mile thick. We're pretty sure that the crater was caused by a meteor because it has characteristics traditionally associated with those kinds of impacts, like a bowl shape and central peaks.

It’s also one of the 25 largest impact craters in the world, large enough to hold the cities of Paris or Washington, D.C. The meteor that created it was likely half a mile wide.

Currently, there’s still lots to learn about the crater – and the meteor that created it – but it’s likely relatively young in geologic timescales. The meteor hit Earth within the last 3 million years, but the impact could have been as recent as 13,000 years ago.

While it was likely smaller than the meteor credited with knocking out the dinosaurs, this impact could have potentially caused a large influx of fresh water into the northern Atlantic Ocean, which would have had profound impacts for life in the region at the time.

Go here to learn more about this discovery: https://www.nasa.gov/press-release/international-team-nasa-make-unexpected-discovery-under-greenland-ice

Operation IceBridge continues to uncover the hidden secrets under Earth's ice. IceBridge has been flying for 10 years, providing a data bridge between ICESat, which flew from 2003 to 2009, and ICESat-2, which launched in September. IceBridge uses a suite of instruments to help track the changing height and thickness of the ice and the snow cover above it. IceBridge also measures the bedrock below the ice, which allows for discoveries like this crater.
Make sure to follow us on Tumblr for your regular dose of space: http://nasa.tumblr.com
Frozen: Ice on Earth and Well Beyond

Icy Hearts: A heart-shaped calving front of a glacier in Greenland (left) and Pluto's frozen plains (right). Credits: NASA/Maria-Jose Viñas and NASA/APL/SwRI
From deep below the soil at Earth’s polar regions to Pluto’s frozen heart, ice exists all over the solar system...and beyond. From right here on our home planet to moons and planets millions of miles away, we’re exploring ice and watching how it changes. Here’s 10 things to know:
1. Earth’s Changing Ice Sheets

An Antarctic ice sheet. Credit: NASA
Ice sheets are massive expanses of ice that stay frozen from year to year and cover more than 6 million square miles. On Earth, ice sheets extend across most of Greenland and Antarctica. These two ice sheets contain more than 99 percent of the planet’s freshwater ice. However, our ice sheets are sensitive to the changing climate.
Data from our GRACE satellites show that the land ice sheets in both Antarctica and Greenland have been losing mass since at least 2002, and the speed at which they’re losing mass is accelerating.
2. Sea Ice at Earth’s Poles

Earth’s polar oceans are covered by stretches of ice that freezes and melts with the seasons and moves with the wind and ocean currents. During the autumn and winter, the sea ice grows until it reaches an annual maximum extent, and then melts back to an annual minimum at the end of summer. Sea ice plays a crucial role in regulating climate – it’s much more reflective than the dark ocean water, reflecting up to 70 percent of sunlight back into space; in contrast, the ocean reflects only about 7 percent of the sunlight that reaches it. Sea ice also acts like an insulating blanket on top of the polar oceans, keeping the polar wintertime oceans warm and the atmosphere cool.
Some Arctic sea ice has survived multiple years of summer melt, but our research indicates there’s less and less of this older ice each year. The maximum and minimum extents are shrinking, too. Summertime sea ice in the Arctic Ocean now routinely covers about 30-40 percent less area than it did in the late 1970s, when near-continuous satellite observations began. These changes in sea ice conditions enhance the rate of warming in the Arctic, already in progress as more sunlight is absorbed by the ocean and more heat is put into the atmosphere from the ocean, all of which may ultimately affect global weather patterns.
3. Snow Cover on Earth

Snow extends the cryosphere from the poles and into more temperate regions.
Snow and ice cover most of Earth’s polar regions throughout the year, but the coverage at lower latitudes depends on the season and elevation. High-elevation landscapes such as the Tibetan Plateau and the Andes and Rocky Mountains maintain some snow cover almost year-round. In the Northern Hemisphere, snow cover is more variable and extensive than in the Southern Hemisphere.
Snow cover the most reflective surface on Earth and works like sea ice to help cool our climate. As it melts with the seasons, it provides drinking water to communities around the planet.
4. Permafrost on Earth

Tundra polygons on Alaska's North Slope. As permafrost thaws, this area is likely to be a source of atmospheric carbon before 2100. Credit: NASA/JPL-Caltech/Charles Miller
Permafrost is soil that stays frozen solid for at least two years in a row. It occurs in the Arctic, Antarctic and high in the mountains, even in some tropical latitudes. The Arctic’s frozen layer of soil can extend more than 200 feet below the surface. It acts like cold storage for dead organic matter – plants and animals.
In parts of the Arctic, permafrost is thawing, which makes the ground wobbly and unstable and can also release those organic materials from their icy storage. As the permafrost thaws, tiny microbes in the soil wake back up and begin digesting these newly accessible organic materials, releasing carbon dioxide and methane, two greenhouse gases, into the atmosphere.
Two campaigns, CARVE and ABoVE, study Arctic permafrost and its potential effects on the climate as it thaws.
5. Glaciers on the Move

Did you know glaciers are constantly moving? The masses of ice act like slow-motion rivers, flowing under their own weight. Glaciers are formed by falling snow that accumulates over time and the slow, steady creep of flowing ice. About 10 percent of land area on Earth is covered with glacial ice, in Greenland, Antarctica and high in mountain ranges; glaciers store much of the world's freshwater.
Our satellites and airplanes have a bird’s eye view of these glaciers and have watched the ice thin and their flows accelerate, dumping more freshwater ice into the ocean, raising sea level.
6. Pluto’s Icy Heart

The nitrogen ice glaciers on Pluto appear to carry an intriguing cargo: numerous, isolated hills that may be fragments of water ice from Pluto's surrounding uplands. NASA/Johns Hopkins University Applied Physics Laboratory/Southwest Research Institute
Pluto’s most famous feature – that heart! – is stone cold. First spotted by our New Horizons spacecraft in 2015, the heart’s western lobe, officially named Sputnik Planitia, is a deep basin containing three kinds of ices – frozen nitrogen, methane and carbon monoxide.
Models of Pluto’s temperatures show that, due the dwarf planet’s extreme tilt (119 degrees compared to Earth’s 23 degrees), over the course of its 248-year orbit, the latitudes near 30 degrees north and south are the coldest places – far colder than the poles. Ice would have naturally formed around these latitudes, including at the center of Sputnik Planitia.
New Horizons also saw strange ice formations resembling giant knife blades. This “bladed terrain” contains structures as tall as skyscrapers and made almost entirely of methane ice, likely formed as erosion wore away their surfaces, leaving dramatic crests and sharp divides. Similar structures can be found in high-altitude snowfields along Earth’s equator, though on a very different scale.
7. Polar Ice on Mars

This image, combining data from two instruments aboard our Mars Global Surveyor, depicts an orbital view of the north polar region of Mars. Credit: NASA/JPL-Caltech/MSSS
Mars has bright polar caps of ice easily visible from telescopes on Earth. A seasonal cover of carbon dioxide ice and snow advances and retreats over the poles during the Martian year, much like snow cover on Earth.

This animation shows a side-by-side comparison of CO2 ice at the north (left) and south (right) Martian poles over the course of a typical year (two Earth years). This simulation isn't based on photos; instead, the data used to create it came from two infrared instruments capable of studying the poles even when they're in complete darkness. This data were collected by our Mars Reconnaissance Orbiter, and Mars Global Surveyor. Credit: NASA/JPL-Caltech
During summertime in the planet's north, the remaining northern polar cap is all water ice; the southern cap is water ice as well, but remains covered by a relatively thin layer of carbon dioxide ice even in summertime.
Scientists using radar data from our Mars Reconnaissance Orbiter found a record of the most recent Martian ice age in the planet's north polar ice cap. Research indicates a glacial period ended there about 400,000 years ago. Understanding seasonal ice behavior on Mars helps scientists refine models of the Red Planet's past and future climate.
8. Ice Feeds a Ring of Saturn

Wispy fingers of bright, icy material reach tens of thousands of kilometers outward from Saturn's moon Enceladus into the E ring, while the moon's active south polar jets continue to fire away. Credit: NASA/JPL/Space Science Institute
Saturn’s rings and many of its moons are composed of mostly water ice – and one of its moons is actually creating a ring. Enceladus, an icy Saturnian moon, is covered in “tiger stripes.” These long cracks at Enceladus’ South Pole are venting its liquid ocean into space and creating a cloud of fine ice particles over the moon's South Pole. Those particles, in turn, form Saturn’s E ring, which spans from about 75,000 miles (120,000 kilometers) to about 260,000 miles (420,000 kilometers) above Saturn's equator. Our Cassini spacecraft discovered this venting process and took high-resolution images of the system.

Jets of icy particles burst from Saturn’s moon Enceladus in this brief movie sequence of four images taken on Nov. 27, 2005. Credit: NASA/JPL/Space Science Institute
9. Ice Rafts on Europa

View of a small region of the thin, disrupted, ice crust in the Conamara region of Jupiter's moon Europa showing the interplay of surface color with ice structures. Credit: NASA/JPL/University of Arizona
The icy surface of Jupiter’s moon Europa is crisscrossed by long fractures. During its flybys of Europa, our Galileo spacecraft observed icy domes and ridges, as well as disrupted terrain including crustal plates that are thought to have broken apart and "rafted" into new positions. An ocean with an estimated depth of 40 to 100 miles (60 to 150 kilometers) is believed to lie below that 10- to 15-mile-thick (15 to 25 km) shell of ice.
The rafts, strange pits and domes suggest that Europa’s surface ice could be slowly turning over due to heat from below. Our Europa Clipper mission, targeted to launch in 2022, will conduct detailed reconnaissance of Europa to see whether the icy moon could harbor conditions suitable for life.
10. Crater Ice on Our Moon

The image shows the distribution of surface ice at the Moon’s south pole (left) and north pole (right), detected by our Moon Mineralogy Mapper instrument. Credit: NASA
In the darkest and coldest parts of our Moon, scientists directly observed definitive evidence of water ice. These ice deposits are patchy and could be ancient. Most of the water ice lies inside the shadows of craters near the poles, where the warmest temperatures never reach above -250 degrees Fahrenheit. Because of the very small tilt of the Moon’s rotation axis, sunlight never reaches these regions.
A team of scientists used data from a our instrument on India’s Chandrayaan-1 spacecraft to identify specific signatures that definitively prove the water ice. The Moon Mineralogy Mapper not only picked up the reflective properties we’d expect from ice, but was able to directly measure the distinctive way its molecules absorb infrared light, so it can differentiate between liquid water or vapor and solid ice.
With enough ice sitting at the surface – within the top few millimeters – water would possibly be accessible as a resource for future expeditions to explore and even stay on the Moon, and potentially easier to access than the water detected beneath the Moon’s surface.
11. Bonus: Icy World Beyond Our Solar System!

With an estimated temperature of just 50K, OGLE-2005-BLG-390L b is the chilliest exoplanet yet discovered. Pictured here is an artist's concept. Credit: NASA
OGLE-2005-BLG-390Lb, the icy exoplanet otherwise known as Hoth, orbits a star more than 20,000 light years away and close to the center of our Milky Way galaxy. It’s locked in the deepest of deep freezes, with a surface temperature estimated at minus 364 degrees Fahrenheit (minus 220 Celsius)!
Make sure to follow us on Tumblr for your regular dose of space: http://nasa.tumblr.com.
OMG! Ice is Melting from Below

Oceans Melting Greenland (OMG) scientists are heading into the field this week to better understand how seawater is melting Greenland’s ice from below. (Yes, those black specks are people next to an iceberg.) While NASA is studying ocean properties (things like temperature, salinity and currents), other researchers are eager to incorporate our data into their work. In fact, University of Washington scientists are using OMG data to study narwhals – smallish whales with long tusks – otherwise known as the “unicorns of the sea.”
Our researchers are also in the field right now studying how Alaska’s ice is changing. Operation IceBridge, our longest airborne campaign, is using science instruments on airplanes to study and measure the ice below.
What happens in the Arctic doesn’t stay in the Arctic (or the Antarctic, really). In a warming world, the greatest changes are seen in the coldest places. Earth’s cryosphere – its ice sheets, sea ice, glaciers, permafrost and snow cover – acts as our planet’s thermostat and deep freeze, regulating temperatures and storing most of our freshwater. Next month, we’re launching ICESat-2, our latest satellite to study Earth’s ice!
Make sure to follow us on Tumblr for your regular dose of space: http://nasa.tumblr.com.
Solar System: 10 Things to Know
All About Ice
1. Earth's Changing Cryosphere

This year, we will launch two satellite missions that will increase our understanding of Earth's frozen reaches. Snow, ice sheets, glaciers, sea ice and permafrost, known as the cryosphere, act as Earth's thermostat and deep freeze, regulating temperatures by reflecting heat from the Sun and storing most of our fresh water.
2. GRACE-FO: Building on a Legacy and Forging Ahead

The next Earth science satellites set to launch are twins! The identical satellites of the GRACE Follow-On mission will build on the legacy of their predecessor GRACE by also tracking the ever-changing movement of water around our planet, including Earth's frozen regions. GRACE-FO, a partnership between us and the German Research Center for Geosciences (GFZ), will provide critical information about how the Greenland and Antarctic ice sheets are changing. GRACE-FO, working together, will measure the distance between the two satellites to within 1 micron (much less than the width of a human hair) to determine the mass below.

Greenland has been losing about 280 gigatons of ice per year on average, and Antarctica has lost almost 120 gigatons a year with indications that both melt rates are increasing. A single gigaton of water would fill about 400,000 Olympic-sized swimming pools; each gigaton represents a billion tons of water.
3. ICESat-2: 10,000 Laser Pulses a Second

In September, we will launch ICESat-2, which uses a laser instrument to precisely measure the changing elevation of ice around the world, allowing scientists to see whether ice sheets and glaciers are accumulating snow and ice or getting thinner over time. ICESat-2 will also make critical measurements of the thickness of sea ice from space. Its laser instrument sends 10,000 pulses per second to the surface and will measure the photons' return trip to satellite. The trip from ICESat-2 to Earth and back takes about 3.3 milliseconds.
4. Seeing Less Sea Ice

Summertime sea ice in the Arctic Ocean now routinely covers about 40% less area than it did in the late 1970s, when continuous satellite observations began. This kind of significant change could increase the rate of warming already in progress and affect global weather patterns.
5. The Snow We Drink

In the western United States, 1 in 6 people rely on snowpack for water. Our field campaigns such as the Airborne Snow Observatory and SnowEx seek to better understand how much water is held in Earth's snow cover, and how we could ultimately measure this comprehensively from space.
6. Hidden in the Ground

Permafrost - permanently frozen ground in the Arctic that contains stores of heat-trapping gases such as methane and carbon dioxide - is thawing at faster rates than previously observed. Recent studies suggest that within three to four decades, this thawing could be releasing enough greenhouse gases to make Arctic permafrost a net source of carbon dioxide rather than a sink. Through airborne and field research on missions such as CARVE and ABoVE - the latter of which will put scientists back in the field in Alaska and Canada this summer - our scientists are trying to improve measurements of this trend in order to better predict global impact.
7. Breaking Records Over Cracking Ice

Last year was a record-breaking one for Operation IceBridge, our aerial survey of polar ice. For the first time in its nine-year history, the mission carried out seven field campaigns in the Arctic and Antarctic in a single year. In total, the IceBridge scientists and instruments flew over 214,000 miles, the equivalent of orbiting the Earth 8.6 times at the equator.

On March 22, we completed the first IceBridge flight of its spring Arctic campaign with a survey of sea ice north of Greenland. This year marks the 10th Arctic spring campaign for IceBridge. The flights continue until April 27 extending the mission's decade-long mapping of the fastest-changing areas of the Greenland Ice Sheet and measuring sea ice thickness across the western Arctic basin.
8. OMG

Researchers were back in the field this month in Greenland with our Oceans Melting Greenland survey. The airborne and ship-based mission studies the ocean's role in melting Greenland's ice. Researchers examine temperatures, salinity and other properties of North Atlantic waters along the more than 27,000 miles (44,000 km) of jagged coastline.
9. DIY Glacier Modeling

Computer models are critical tools for understanding the future of a changing planet, including melting ice and rising seas. Our new sea level simulator lets you bury Alaska's Columbia glacier in snow, and, year by year, watch how it responds. Or you can melt the Greenland and Antarctic ice sheets and trace rising seas as they inundate the Florida coast.
10. Ice Beyond Earth

Ice is common in our solar system. From ice packed into comets that cruise the solar system to polar ice caps on Mars to Europa and Enceladus-the icy ocean moons of Jupiter and Saturn-water ice is a crucial ingredient in the search for life was we know it beyond Earth.
Read the full version of this week’s 10 Things to Know HERE.
Make sure to follow us on Tumblr for your regular dose of space: http://nasa.tumblr.com.
Tracking a Warming Arctic – From Underground to High in the Sky
The Arctic is warming much faster than the rest of Earth. This warming is creating big and small changes, some of which could ripple beyond the planet’s frozen regions and affect us world-wide – possibly raising sea levels, increasing greenhouse warming and affecting wildlife.
Our Arctic Boreal Vulnerability Experiment, known as ABoVE, just began a 10-year mission in Alaska and western Canada, studying these changes.
Underground: Permafrost is the layer of frozen soil beneath some Arctic forests and tundra.

Like the name suggests, this icy layer stays solid year-round, so when it does melt, it can create big problems. The soil above the thawing permafrost can collapse, creating this wobbly, unstable surface.
7 feet above sea level: As the permafrost thaws, the soil above it can fall away.

Along the banks of the Itkillik River in Alaska, thawing permafrost has dripped into the water, eroding the cliff side. Known as the “Stinky Bluffs,” this permafrost contains lots of frozen organic matter from dead plants and animals. As the permafrost thaws, this organic matter doesn’t just smell, it also releases carbon dioxide and methane into the atmosphere, adding to the warming effect.
446 feet above sea level: Wildfires aren’t unusual in the forests and shrub lands of Alaska, but as the climate continues to warm, they burn longer and do more damage.

People who live off the land in the region help researchers understand where plant life isn’t growing back after fires.
100-1000 feet above sea level: Researchers set up 100-foot tall towers at strategic locations throughout Alaska to measure carbon dioxide and methane emissions from right above the forest canopy.

This provides an up-close look at what gases are released or absorbed from the trees, or swirl in from neighboring regions. These data are combined with measurements taken from airplanes and satellites to create a clearer picture of how much carbon is entering the atmosphere.
3,369 feet above sea level: Dall sheep live in several Alaskan mountain ranges, where they’re critical to both the tourism and sports hunting economies.

Credit: National Park Service
Changes in temperature and vegetation can profoundly affect their behavior, like grazing habits, and so researchers study how changing plant life and snow cover affect the sheep.
100-30,000 feet above sea level: Carbon emissions in the air come from thawing permafrost, fossil fuel burning, decaying vegetation and wildfires burning across the Arctic-boreal regions.

One experiment in the ABoVE campaign measures these emissions with instruments on a DC-8 plane.
About 30,000 feet about sea level: When wildfires burn through vegetation, the effects extend far beyond what we see on the ground.

Fires release carbon stored in the plants into the atmosphere, where it affects air quality and contributes to the greenhouse effect.
438 miles: Our ABoVE campaign combines research on the ground and from planes with data collected by a fleet of Earth-observing satellites, orbiting Earth hundreds of miles above the surface.

Data from these satellites provides information on vegetation, atmospheric particles and gasses, and how humans are impacting our planet. With all these data sets analyzed by computer programs, the result is a comprehensive picture of our warming planet.
Make sure to follow us on Tumblr for your regular dose of space: http://nasa.tumblr.com
Here’s Some_Thing really interesting to Look at.
A Soviet Arctic Exploration Vehicle with Tracks on it.
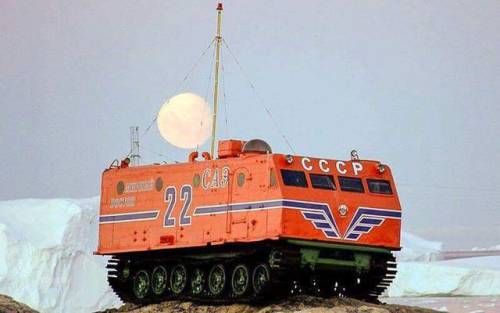
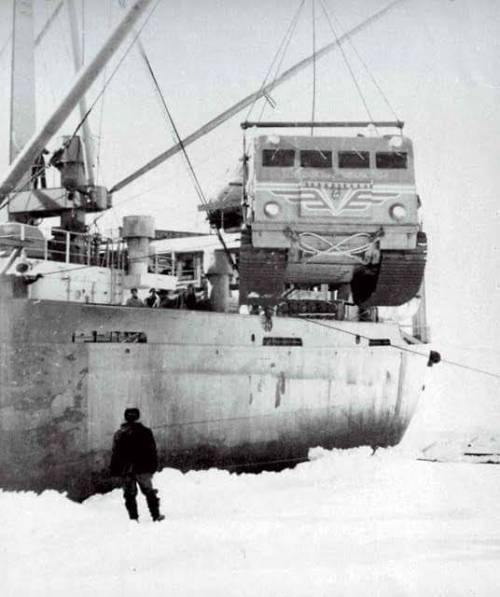


Arctic exploration vehicle Harkovchnka.


Enjoying life on the ice edge | linakayser
Location: Svalbard and Jan Mayen, Norway


Northern light in Finland
Credit -imikegraphic on ig
So I need to babble about a contrast I noticed between two 'cold boys in boats' shows: The Terror and The North Water. So, in The North Water, Jack O'Connell is wonderful as ship's surgeon Patrick Sumner.

But, and this is a regretful but, a decision made by his character/the show's writers just straight up *busted* the show for me. He's supposedly (due to complex backstory reasons) addicted to laudanum/opium. Yet, in the third ep, he apparently decides to send *his whole supply* off with someone else, to somewhere else, and, it being the heckin' arctic, therefore loses it. I remember straight-up pausing the show to go rant to my partner "Is it this bitch's first day as a drug addict? He didn't even keep *any* on his person at all times? Come the heck on!"
Where in The Terror, after three years stuck in ice, this absolute madlad, Mr Blanky, still has his tobacco for his last smoke, on his person, at all times:

And gleefully takes it while waiting for the monsterbear to kill him. *That's* a sailor with an addiction I can believe in!

A Chanda Series 303 Trek droid, for all your arctic travel needs. This one includes a 'howdah'-type hump to carry a passenger. At night, the 'antlers' light the way with a powerful glow.

Whiteout was strong as hell. She deserves so much more
Closeups


What can be worse than making a photo of a traditional painting? The same thing but there are metallic details

I finally found the time to post my art. This will be the first one. Do not pay attention to the time it was made