Latest Posts by dotmpotter - Page 6


Wanted: Shredder for five million tires dumped in Spain
Spanish authorities are struggling to dispose of five million tires dumped on a site close to a housing development north of Toledo. The 90,000 tons’ worth of tires have been dumped there since 2002.
Environmentalists say that should a fire break out, it could not be extinguished with water and would have to be smothered with earth. In the event of a fire, Madrid’s main airport would likely have to be shut down and an estimated 11,000 homes evacuated. | Read more

A Tree of Life For 2.3 MILLION Species!
This week, scientists released this massive tree of life showing the evolutionary relationships between 2.3 million different species, encompassing every scale of life from bacteria to blue whales. This massive undertaking combines more than 500 previous trees into one, the result being the largest and most complete tree of evolutionary relationships as we know them today.
Like evolution itself, this diagram will continue to evolve as scientists fill in gaps and uncover more detailed information on the genetic relationships of Earth’s various species, but it’s not too shabby for a first draft. You can read more from Rachel Feltman at The Washington Post.

This type of wheel-like diagram is called a Hillis plot, one of my favorite ways of illustrating the tree of life. I’ve even found one drawn on an actual tree:

“I think” we’ve come a long way since Darwin’s original 1859 sketch in On The Origin of Species, don’t you?


Mapping the World’s Air Pollution in Real Time
[Image: Air Quality Index China]
Making an impact
ESA - Clean Space Programme logo. 25 September 2015 When a rocket is launched into space it crosses all layers of the atmosphere and interacts with them. How much impact does a launch have on the atmosphere and can we quantify the effect in such a way that we can take mitigation measures? These are only a few of the questions raised by the Clean Space AtILa (Atmospheric Impact of Launchers) project. Neil Murray explains: “It is difficult to use computer modelling to precisely monitor what happens when a rocket is launched as the size of the plume is far smaller than the scale of the climate models that we use to model the atmosphere”.
Picture perfect liftoff
Therefore two strategies were worked out to model the impact, one started from the size of the plume and this was allowed to develop over time and space to the size of the climate model and used as the boundary conditions of the climate model. Another strategy started from the size of the larger model and introduced sub-grid models which modelled the plume within the climate model grids. Both models gave surprisingly similar results. So far it has been thought that chlorine, which is converted from the oxidizer (ammonia perchlorate) in the solid booster fuel mixture, has had the main effect on ozone depletion in the immediate area where the plume is emitted.
Computations conducted at ONERA using the CEDRE code
The latest studies have shown that alumina particles, i.e., oxidised aluminium, which is also present in the solid rocket fuel, may also have a significant ozone depletion effect depending on the particle size. “If the particles are on the micrometer scale they would quickly fall out of the sky and have little impact on the atmosphere. However, the smaller the particles, the higher their combined surface area and the longer they remain suspended in the air, which means that their potential catalytic effect in ozone reduction could also be much higher.” Therefore it is imperative that quantitative data is collected to be able to accurately measure and predict the impact by mathematical models.
Computations conducted at ONERA using the CEDRE code
The first step towards quantitative data is the kick-off of an activity organised in cooperation with DLR whereby a solid rocket motor model in a wind tunnel will be used to simulate the evolution of particles in a representative rocket chamber and to then interpolate this to the conditions at launch. From these measurements accurate models will be developed for predicting the development of alumina particles under real launch conditions. So why not just use real launch data? “It is not that easy to make these measurements during a real launch and so far no data has been collected for European launchers. Up to now we have mainly been relying on data measured by NASA during launches in the 1990s, however, the representativeness of this data with respect to European launchers is questionable. This ultimately leaves us with the task of somehow collecting such flight data and it is something that we are discussing at length.“
Ariane 5 ECA V184 climbout
"Even when we are able to make real-time measurements during a launch it still is a large task to interpret this data correctly and extrapolate this to all launches, as daily changes in the atmosphere and the time of the launch are just a few parameters that severely influence the effect. Luckily we are working with some of Europe’s experts in climatology!” The AtILa project aims to understand the impact of launching its rockets into space by modelling the rocket plumes from their origin in the rocket chamber up to their impact on a global scale using climate models. This is one of the projects that ESA carries out under the Clean Space initiative which has carried out life cycle assessments for the space industry in order to monitor the effect of each space project on the environment. Implementing eco-design strategies into every phase of a space project is the ultimate aim of this initiative. ESA links: Life cycle assessment training at ESA: http://www.esa.int/Our_Activities/Space_Engineering_Technology/Clean_Space/Life_Cycle_Assessment_training_at_ESA Virtual rocket launches will probe atmospheric effects: http://www.esa.int/Our_Activities/Space_Engineering_Technology/Clean_Space/Virtual_rocket_launches_will_probe_atmospheric_effects Considering hydrazine-free satellite propulsion: http://www.esa.int/Our_Activities/Space_Engineering_Technology/Clean_Space/Considering_hydrazine-free_satellite_propulsion ‘Green’ satellite fuel designed to make space safer: http://www.esa.int/Our_Activities/Space_Engineering_Technology/Green_satellite_fuel_designed_to_make_space_safer About Clean Space: What is Clean Space?: http://www.esa.int/Our_Activities/Space_Engineering_Technology/Clean_Space/What_is_Clean_Space Why is it needed?: http://www.esa.int/Our_Activities/Space_Engineering_Technology/Clean_Space/Why_is_it_needed What are its objectives?: http://www.esa.int/Our_Activities/Space_Engineering_Technology/Clean_Space/What_are_its_objectives Images, Text, Credits: ESA/CNES/ARIANESPACE/Photo Optique Vidéo CSG/Service POV du CSG. Best regards, Orbiter.ch Full article

Here’s a recent interview I did with Futurism.

This is the third in a series of articles published by InsideClimate News disclosing that ExxonMobil was conducting an extensive internal research project internally to analyze the effect of carbon emissions on atmospheric CO2, global warming and climate change. It’s clear from the material described and presented in the article that ExxonMobil, within its science group and at the highest management levels, was aware of the risk of climate change from carbon emissions. Notwithstanding that knowledge, ExxonMobil decided to protect its business model and go down the denial path.
What’s amazing is how accurate the ExxonMobil scientists were in their projections of the concentrations of CO2 in the atmosphere and the effect those levels of concentration would have on global warming.
Here’s an example of an internal memorandum. An explanation of this memo, including more on its contents, the context in which it was written and delivered and the identities of the author and addressee, are included in the article.

A timeline of ExxonMobil’s research and external outreach efforts on the climate change issue. If the text is too tiny or blurred, a better copy, which you can enlarge, is included in the article.

NASA Does Hurricanes

When you think of NASA, you probably think of space. Which makes sense, because space is a huge part of what we do. That being said, here at NASA we are also involved in many other research areas, and even play a role in hurricane weather forecasting.
Our satellites, computer modeling, instruments, aircraft and field missions all contribute to a mix of information used by scientists to get a better understanding of these storms. Aspects of storms from rainfall rates to surface wind speed are all analyzed to help identify the potential for storm formation or intensification.

Currently, our satellites are passing overhead as Hurricane Joaquin (above) travels through the Atlantic Ocean. Our Global Precipitation Measurement, or GPM Core satellite captured images and rainfall rates of the storm. GPM showed a large area of very intense rain, which indicates that large amounts of heat are being released into the storm’s center. This fuels the circulation and provides the means for its intensification.
Maximum sustained winds have increased to near 80 mph and additional strengthening is expected. Joaquin could become a major hurricane during the next few days.

In 2016, we’re launching the Cyclone Global Navigation Satellite System (CYGNSS), which is a constellation of eight small satellites. With this launch, we will be able to better understand the rapid intensification of hurricanes, and improve hurricane intensity forecasts.
In addition to our satellite technology, we also conduct field missions to study hurricanes. In our most recent field mission, we investigated the process that underlie hurricane formation and intensity change in the Atlantic Ocean basin.


Watch: eSight could be exactly what people with vision problems need.

Earlier this year, BioDigital partnered with About.com to provide interactive visualizations for common health conditions. Patients searching for information about Type 2 diabetes, for instance, are presented with a 3D model of a cell’s response to insulin, in which they can explore the process from different angles while toggling between diabetic and normal cell function.
What’s revolutionary about the API launch, though, is that now developers can personalize the BioDigital human by integrating their own imaging data, movement data collected by wearables, and health record data, among other sources.
So essentially, instead of clicking around the standard human model on About.com, we could soon be exploring 3D models of our own bodies, constructed with our unique health data.
For athletes especially, the immediate advantages of virtually replicating a moving body are obvious. If you can see exactly which movements inflict pain or stress on your body, it’s much easier to understand how to avoid them.
For medical professionals, though, the ability to visualize vast amounts of health data in real time via the BioDigital human has the potential to change the way new information is analyzed and consumed.
“The human body is this incredible system of systems, and there’s an infinite amount of detail,” says Sculli. “So we can start mapping cellular mechanisms, and genomic and brain activity, and all of this information that’s being collected in masses from research and wearables, and make it consumable for people.”
(via 3D Modeling Startup BioDigital Launches An API For The Human Body | TechCrunch)
KARMA POLICE: GCHQ's plan to track every Web user in the world

The KARMA POLICE program is detailed in newly released Snowden docs published on The Intercept; it began as a project to identify every listener to every Internet radio station (to find people listening to jihadi radio) and grew into an ambitious plan to identify every Web user and catalog their activities from porn habits to Skype contacts.
The program began in 2007/8 and it mined BLACK HOLE, which is GCHQ’s repository for all the data sucked up by its fiber taps (which it calls “probes”). It attempted to map IP addresses to peoples’ identities, and cross reference users’ identities on various systems and in various locations, collecting them into “a web browsing profile for every visible user on the Internet.”
Part of this was accomplished by looking at a users’ cookies – if you log into Google on your phone and your laptop, GCHQ use its surveillance views into that cookie to connect all the traffic from your laptop and phone with a single identity. The agency exploited cookies from a wide variety of popular websites that put like/share buttons, beacons, and other assets on a many other sites. The targeted cookies came from Google, Microsoft, Facebook, Reddit, the BBC, Amazon, WordPress, Yahoo, and others.
KARMA POLICE drew on a frankly bewildering array of other programs, which sucked up data from a variety of sources. These programs were given exotic codenames by GCHQ: SOCIAL ANTHROPOID, MEMORY HOLE, MARBLED GECKO, INFINITE MONKEYS, etc. These logged different kinds of Internet events – search queries, Google Maps searches, and BBS/message-board posts.
The UK spy agency had an extraordinary view into the world’s Internet traffic thanks to the number of oceanic fiber links that make landfall in the UK.
Like the NSA, GCHQ relied on secret interpretations of the laws on spying to paper over its activities, so that it could tell its governmental overseers that all its activities were lawful. It amassed records on people from all over the world, including Britons, and routinely allows its spying partners to search its databases. The US NSA, as well as spy agencies from Canada, Australia, and New Zealand all have access to its data on British citizens and people from all over the world.
Read the rest

A Mesmerizing 3-D Vision of New York as Pure Data

To Fight Inequality, Turn On Clean Energy Everywhere
Much of the world is still held captive by last century’s dirty-energy system that has a long history of locking inequality into place, economically and politically. Look across the world and you will find the vast majority of people subject to the whims of a very few…
Check out the rest of my piece here.

Turns out, in addition to leaving our mark on surfaces, we’re also emitting a bacterial signature into the air—what scientists call a “microbial cloud.” And according to a new study conducted by the Biology and the Built Environment Center at the University of Oregon, this invisible aura is so specific that it can be used to distinguish between individual people.
Our Bodies, Our Microbial Clouds
[Graphic: Viputheshwar Sitaraman/Draw Science]

A good way to remember the human bones in the body. Dope pic
www.learninghumananatomy.com

A new speech about climate change is fascinating both for what it says and who said it.
Mark Carney, the governor of the Bank of England, declared that the warming climate presented major risks for the global economy and global financial stability, and that businesses and regulators needed to move more quickly to try to contain the potential economic damage even though it may seem uncertain and far off.
His warning, delivered in a 4,400-word speech with ample footnotes on Tuesday, is the latest example of how climate change has moved beyond theoretical scientific debates to the start of practical planning for safeguarding the economy and business.
“We don’t need an army of actuaries to tell us that the catastrophic impacts of climate change will be felt beyond the traditional horizons of most actors — imposing a cost on future generations that the current generation has no direct incentive to fix,” he said. “In other words, once climate change becomes a defining issue for financial stability, it may already be too late.”
Mr. Carney calls the economic challenges around climate the “tragedy of the horizon,” in contrast to the long-noted economic phenomenon of the “tragedy of the commons.” That is, the costs of a warming climate come on a time scale and with an uncertainty that go beyond the usual multiyear business cycle, beyond political cycles of presidential and parliamentary elections, or as he puts it, beyond “the horizon of technocratic authorities, like central banks, who are bound by their mandates.”
It might seem odd for a central banker to be talking about a long-term problem of global climate, all the more so when the global economy is looking rather shaky. After all, the job is typically to worry about price inflation and the banking system.
But if you back up and define a central banker’s job a little more broadly — to worrying about the economy and the stability of the financial system writ large — it quickly becomes clear why climate matters.
Good read from NYTimes.
Want to know more about how millions of people are forced to pick cotton by the Government of Uzbekistan every year?
This video explains the issue clearly in just two minutes:

Apparently, because of the earlier thawing of the permafrost, and the increasing amount of permafrost that is melting each, each because of climate change, the Alaska state bird, aka the mosquito, is swarming in unprecedented numbers. The article tells us that mosquitos can kill a baby caribou calf by draining its blood, because the calf is already weakened by the scarcity of food sources also attributable to climate change.
Here’s a video, showing mosquitos swarming in Alaska and annoying a baby owl and a herd of caribou.
Check out these photos, taken by scientists in Alaska. If mosquitos make you squirm, close your eyes:


Silicon Carbide (SiC) is a key building block for next-generation devices. It takes features from diamonds, one of the toughest materials in the world, and combines them with features of silicon, our ubiquitous semiconductor technology in electronics to make a very new kind of material for power electronics. SiC can more efficiently handle higher voltage and three times the amount of energy compared to silicon chips, allowing us to run everything from locomotives to planes and wind farms faster and more efficiently.


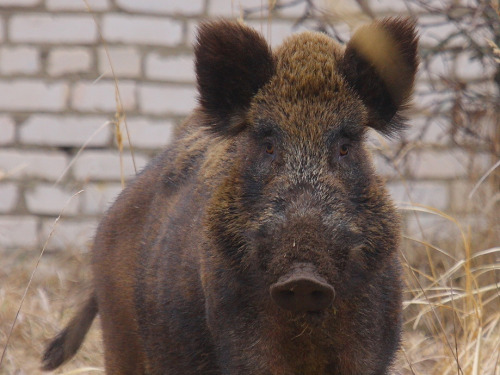

On April 26, 1986, a power surge caused an explosion at the Chernobyl Nuclear Power Plant near Pripyat, Ukraine. A large quantity of radioactive material was released.
On May 2, 1986, the Soviet government established a “Zone of Alienation” or “Exclusion Zone” around Chernobyl – a thousand square miles of “radioactive wasteland.” All humans were evacuated. The town of Pripyat was completely abandoned.
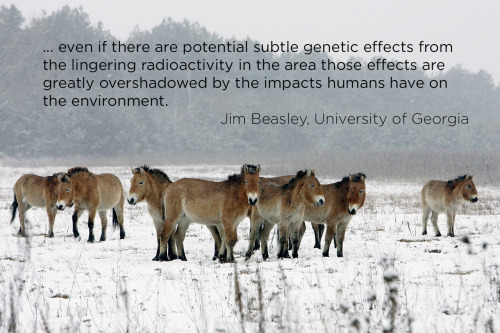
But the animals didn’t leave. And a new study, published this month in Current Biology, suggests they are doing fine. “None of our three hypotheses postulating radiation damage to large mammal populations at Chernobyl were supported by the empirical evidence,” says Jim Beasley, one of the researchers.
In fact, some of the populations have grown. These photos (mostly taken by Valeriy Yurko) come from the Belarusian side of the Exclusion Zone, and area called the Polessye State Radioecological Reserve. Kingfisher, elk, boar, baby spotted eagles, wild ponies, moose, rabbits, and wolves all make their home in the park. In some ways, human presence is worse for wildlife than a nuclear disaster.
Image credits:
1986 Chernobyl - ZUFAROV/AFP/Getty Images
Wildlife photos - Valeriy Yurko/Polessye State Radioecological Reserve
Ponies in winter - SERGEI SUPINSKY/AFP/Getty Images


Earthprints: Aletsch Glacier
One of Europe’s biggest glaciers, the Great Aletsch, coils 14 miles through the Swiss Alps - and yet this mighty river of ice could almost vanish in the lifetimes of people born today because of climate change. The glacier, 900 meters (2,950 feet) thick at one point, has retreated about 3 km (1.9 miles) since 1870 and that pace is quickening, as with many other glaciers around the globe.
That is feeding more water into the oceans and raising world sea levels. It was only after I got down onto the ice, with spikes on my boots for grip and often roped to my guide for safety, that I appreciated the full scale of the glacier, on the south side of the Jungfraujoch railway station.
And yet even the Great Aletsch glacier, the biggest in the Alps and visible from space, is under threat from the build-up of greenhouse gases in the atmosphere from factories, power plants and cars that are blamed for global warming. (REUTERS) Photography by Denis Balibouse/REUTERS Read: Vast Alpine glacier could almost vanish by 2100 due to warming See more photos of the Great Aletsch and our other slideshows on Yahoo News.

New interactive map shows how rising seas will swallow US cities
While there’s unarguably greater awareness than ever that man-made climate change is contributing to global warming and rising sea levels, it can be difficult to visualise what that exactly means for the city you live in. How high will sea levels rise? When will it happen? Where will it happen? And, most importantly, what can we do about it?
These are the questions that this stunning new interactive map is designed to get you thinking about. Mapping Choices is part Google Maps, part time machine. It lets you choose any US city or zip code to see what rising seas will do to your nominated address, based on a range of projections about how high sea levels could increase.
- ScienceAlert

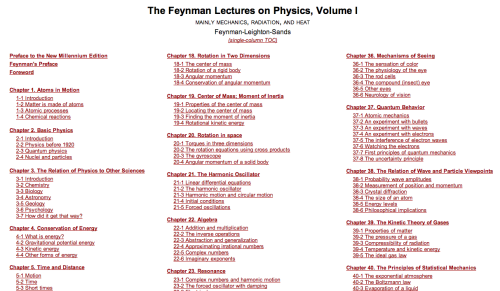
Richard Feynman’s legendary lectures on physics, all fifty-two chapters, are now available to read online via Caltech.
Of course, you can always watch seven of them in video form thanks to Bill Gates.
If anyone needs me, I’ll be in my physics bunk.

Computer Model to Help Manage Hydropower in Kenya
The World's Commercial Shipping Routes
by Grolltech on Wikipedia:

This map of shipping routes illustrates the present-day density of commercial shipping in the world’s oceans.
Via Reddit and Wikipedia, data from the National Center for Ecological Analysis and Synthesis


Design With Cities, Not For Them


Iceland to Help Develop Geothermal Energy in Ethiopia

Cities as a Lab: Designing the Innovation Economy demonstrates how design can foster innovative approaches to the changing needs of American cities. The world is increasingly urbanizing and cities and their wider metropolitan areas are asserting themselves as a fundamental unit of the global economy. Cities can thrive by building transformational places that incubate creativity and adapt to future challenges and opportunities. Cities as a Lab explores the design and policy choices now creating the great places of the future: urban design interventions, visionary planning efforts, and public-private partnerships. The fabric of the city, with its people, buildings, commerce, and transportation networks, promotes relationship formation, business creation, and game-changing ideas.

Governments aren’t doing much to halt global warming but there is hope in the business world. Here are the companies that are facing up to the challenge.
Not my usual climate post. But, BMW is #1.