A Solar Eclipse Seen From Space.


A solar eclipse seen from space.
More Posts from Ad-astra-affecte-spe and Others
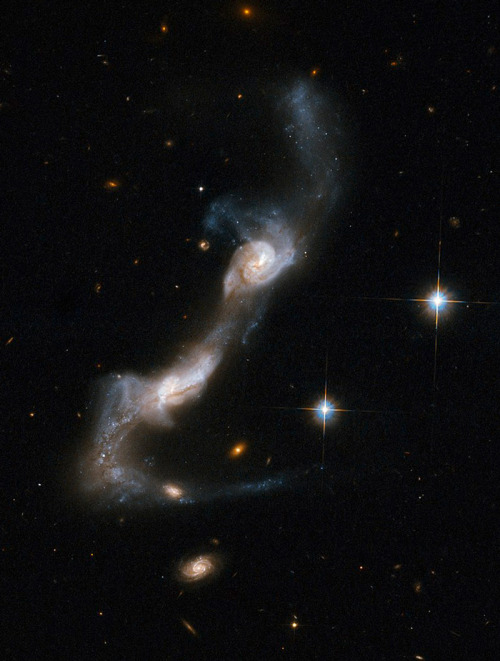
Cosmic Dance of Spiral Galaxies: Arp 238

Saturn and its amazing rings, observed by the Cassini probe on this day in 2004.


Galaxies can merge, collide, or brush past one another — each of which has a significant impact on their shapes and structures. As common as these interactions are thought to be in the Universe, it is rare to capture an image of two galaxies interacting in such a visibly dynamic way. This image, from the NASA/ESA Hubble Space Telescope, feels incredibly three-dimensional for a piece of deep-space imagery.
The subject of this image is named Arp 282, an interacting galaxy pair that is composed of the Seyfert galaxy NGC 169 (bottom) and the galaxy IC 1559 (top).
Credits: ESA/Hubble & NASA, J. Dalcanton, Dark Energy Survey, J. Schmidt

Boo! Did we get you? 🎃
This solar jack-o-lantern, captured by our Solar Dynamics Observatory (SDO) in October 2014, gets its ghoulish grin from active regions on the Sun, which emit more light and energy than the surrounding dark areas. Active regions are markers of an intense and complex set of magnetic fields hovering in the sun’s atmosphere.
The SDO has kept an unblinking eye on the Sun since 2010, recording phenomena like solar flares and coronal loops. It measures the Sun’s interior, atmosphere, magnetic field, and energy output, helping us understand our nearest star.
Grab the high-resolution version here.
Make sure to follow us on Tumblr for your regular dose of space!


Saturn has a mysterious hexagon at its north pole that has refused to give up its secrets, probably because neither Voyager 1 nor Cassini was able to plunge that deep and survive. Harvard scientists Rakesh Yadav and Jeremy Bloxham might have finally started to figure out what causes this peculiar feature. They believe that vortexes occur at the planet’s north pole because of atmospheric flows deep within the gas giant, and that these vortexes pinch an intense horizontal jet near the equator—which is what warps the storm into a hexagon. It still looks unnatural though.....!!!
Cosmic Alphabet Soup: Classifying Stars

If you’ve spent much time stargazing, you may have noticed that while most stars look white, some are reddish or bluish. Their colors are more than just pretty – they tell us how hot the stars are. Studying their light in greater detail can tell us even more about what they’re like, including whether they have planets. Two women, Williamina Fleming and Annie Jump Cannon, created the system for classifying stars that we use today, and we’re building on their work to map out the universe.

By splitting starlight into spectra – detailed color patterns that often feature lots of dark lines – using a prism, astronomers can figure out a star’s temperature, how long it will burn, how massive it is, and even how big its habitable zone is. Our Sun’s spectrum looks like this:

Astronomers use spectra to categorize stars. Starting at the hottest and most massive, the star classes are O, B, A, F, G (like our Sun), K, M. Sounds like cosmic alphabet soup! But the letters aren’t just random – they largely stem from the work of two famous female astronomers.

Williamina Fleming, who worked as one of the famous “human computers” at the Harvard College Observatory starting in 1879, came up with a way to classify stars into 17 different types (categorized alphabetically A-Q) based on how strong the dark lines in their spectra were. She eventually classified more than 10,000 stars and discovered hundreds of cosmic objects!

That was back before they knew what caused the dark lines in spectra. Soon astronomers discovered that they’re linked to a star’s temperature. Using this newfound knowledge, Annie Jump Cannon – one of Fleming’s protégés – rearranged and simplified stellar classification to include just seven categories (O, B, A, F, G, K, M), ordered from highest to lowest temperature. She also classified more than 350,000 stars!

Type O stars are both the hottest and most massive in the new classification system. These giants can be a thousand times bigger than the Sun! Their lifespans are also around 1,000 times shorter than our Sun’s. They burn through their fuel so fast that they only live for around 10 million years. That’s part of the reason they only make up a tiny fraction of all the stars in the galaxy – they don’t stick around for very long.

As we move down the list from O to M, stars become progressively smaller, cooler, redder, and more common. Their habitable zones also shrink because the stars aren’t putting out as much energy. The plus side is that the tiniest stars can live for a really long time – around 100 billion years – because they burn through their fuel so slowly.

Astronomers can also learn about exoplanets – worlds that orbit other stars – by studying starlight. When a planet crosses in front of its host star, different kinds of molecules in the planet’s atmosphere absorb certain wavelengths of light.
By spreading the star’s light into a spectrum, astronomers can see which wavelengths have been absorbed to determine the exoplanet atmosphere’s chemical makeup. Our James Webb Space Telescope will use this method to try to find and study atmospheres around Earth-sized exoplanets – something that has never been done before.

Our upcoming Nancy Grace Roman Space Telescope will study the spectra from entire galaxies to build a 3D map of the cosmos. As light travels through our expanding universe, it stretches and its spectral lines shift toward longer, redder wavelengths. The longer light travels before reaching us, the redder it becomes. Roman will be able to see so far back that we could glimpse some of the first stars and galaxies that ever formed.
Learn more about how Roman will study the cosmos in our other posts:
Roman’s Family Portrait of Millions of Galaxies
New Rose-Colored Glasses for Roman
How Gravity Warps Light
Make sure to follow us on Tumblr for your regular dose of space!


Star Trails in Western Australia by Trevor Dobson

2023 December 16
Crescent Enceladus Image Credit: Cassini Imaging Team, SSI, JPL, ESA, NASA
Explanation: Peering from the shadows, the Saturn-facing hemisphere of tantalizing inner moon Enceladus poses in this Cassini spacecraft image. North is up in the dramatic scene captured during November 2016 as Cassini’s camera was pointed in a nearly sunward direction about 130,000 kilometers from the moon’s bright crescent. In fact, the distant world reflects over 90 percent of the sunlight it receives, giving its surface about the same reflectivity as fresh snow. A mere 500 kilometers in diameter, Enceladus is a surprisingly active moon. Data and images collected during Cassini’s flybys have revealed water vapor and ice grains spewing from south polar geysers and evidence of an ocean of liquid water hidden beneath the moon’s icy crust.
∞ Source: apod.nasa.gov/apod/ap231216.html
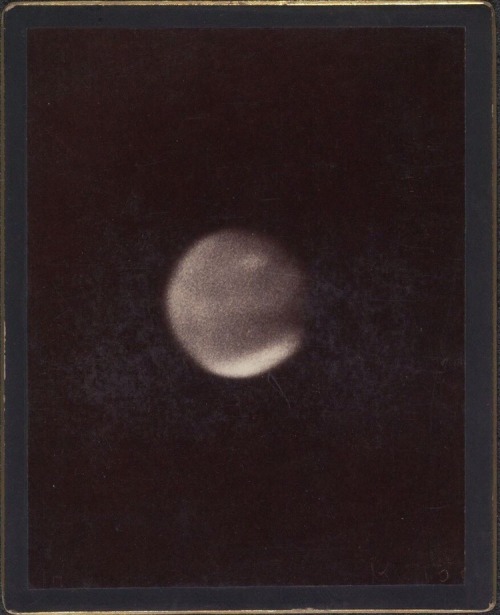
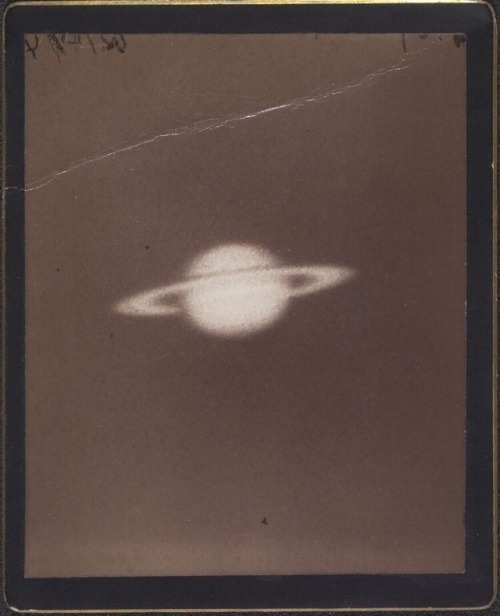
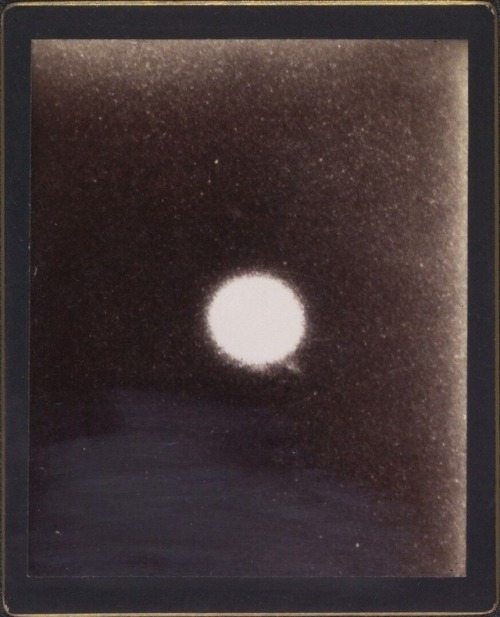
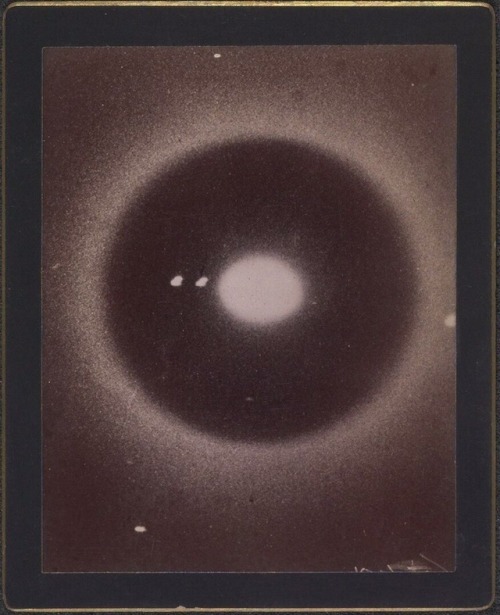
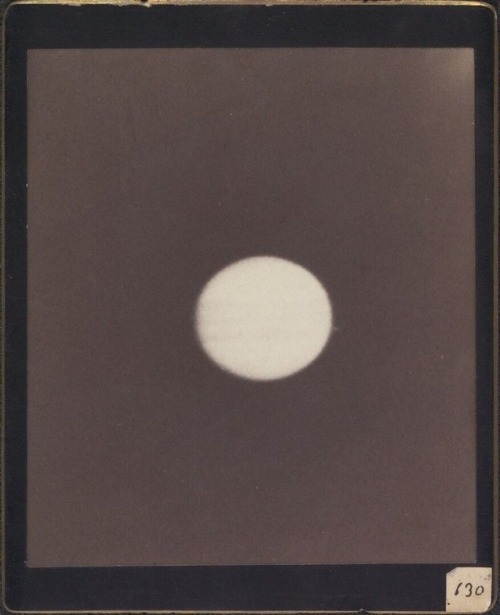
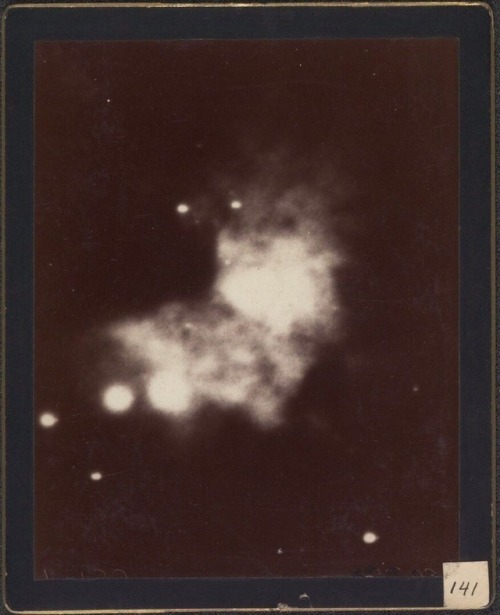
Astronomical photographs, Harvard College Observatory, Cambridge, 1890-1920

Into the Cosmic Heart, IC 1850 © Aleix Roig
-
 cramschoolcorp liked this · 1 week ago
 -
 x974 reblogged this · 1 week ago
 -
 only-i8 reblogged this · 1 month ago
 -
 turki996 liked this · 1 month ago
 -
 vnconsciouss reblogged this · 1 month ago
 -
 holymoly33 reblogged this · 1 month ago
 -
 eightb-all liked this · 1 year ago
 -
 katastrophic-n3vulaa reblogged this · 1 year ago
 -
katastrophic-n3vulaa reblogged this · 1 year ago
-
 gashmiltz liked this · 1 year ago
 -
 geneinspace reblogged this · 1 year ago
 -
 w9juz liked this · 1 year ago
 -
 gallifreyianrosearkytiorsusan liked this · 1 year ago
 -
 rea-hydrangea liked this · 1 year ago
 -
 messier47 reblogged this · 1 year ago
 -
 dwcouch liked this · 1 year ago
 -
 fapaul24 liked this · 1 year ago
 -
 space-addicts reblogged this · 1 year ago
 -
 takuarg liked this · 1 year ago
 -
 lost-redditor liked this · 1 year ago
 -
 internet-society liked this · 1 year ago
 -
 quantumnoodle liked this · 1 year ago
 -
 nostalgicmiddleearth liked this · 1 year ago
 -
 mandizo reblogged this · 1 year ago
 -
 chemposting liked this · 1 year ago
 -
 bienvenidocruz liked this · 1 year ago
 -
 cococonteppi reblogged this · 1 year ago
 -
 spoke-is-here reblogged this · 1 year ago
 -
 laxmia liked this · 1 year ago
 -
 sakasekirumade reblogged this · 1 year ago
 -
 axonsandsynapses liked this · 1 year ago
 -
 joycrispy liked this · 1 year ago
 -
 unlettered-heathen reblogged this · 1 year ago
 -
 oligarch-anathema reblogged this · 1 year ago
 -
 fera-superesse reblogged this · 1 year ago
 -
 bleachtrippin liked this · 1 year ago
 -
 ktylow liked this · 1 year ago
 -
 heteroeroticsubtext liked this · 1 year ago
 -
meh13434 liked this · 1 year ago
-
 mantinos liked this · 1 year ago
 -
 pride-of-pantala reblogged this · 1 year ago
 -
 catfishofoldin99colours liked this · 1 year ago
 -
 captain-acab reblogged this · 1 year ago
 -
 matrim-cauthons-hat reblogged this · 1 year ago
 -
matrim-cauthons-hat liked this · 1 year ago
-
 drakeandjoshwiki liked this · 1 year ago
 -
 mybedofdreams reblogged this · 1 year ago

★•Astronomy, Physics, and Aerospace•★ Original and Reblogged Content curated by a NASA Solar System Ambassador
204 posts