Earth Science - Blog Posts
It’s a Bird! It’s a Plane! It’s NASA’s Five Newest Airborne Campaigns!
We’re not just doing research in space! From the land, the sea and the sky, we study our planet up close. Right now, we’re gearing up for our newest round of Earth Expeditions, using planes, boats and instruments on the ground to study Earth and how it’s changing.

The newest round of campaigns takes place all across the United States – from Virginia to Louisiana to Kansas to California.

The five newest missions will combine measurements from the ground, the sea, air and space to investigate storms, sea level rise and processes in the atmosphere and ocean.
Let’s meet the newest Earth science missions:
1. IMPACTS
The Investigation of Microphysics and Precipitation for Atlantic Coast-Threatening Snowstorms will start from Wallops Flight Facility in Virginia to understand how bands of snow form during winter storms in the East Coast. This research will help us better forecast intense snowfall during extreme winter weather.

2. ACTIVATE
Flying out of Langley Research Center, the Aerosol Cloud Meteorology Interactions over the Western Atlantic Experiment is studying how specific types of clouds over oceans affect Earth’s energy balance and water cycle. The energy balance is the exchange of heat and light from the Sun entering Earth’s atmosphere vs. what escapes back into space.

3. Delta-X
Farther south, Delta-X is flying three planes around the Mississippi River Delta to study how land is deposited and maintained by natural processes. Studying these processes can help us understand what will happen as sea levels continue to rise.

4. DCOTSS
Heading out to the Midwest this summer, the Dynamics and Chemistry of the Summer Stratosphere mission will study how thunderstorms can carry pollutants from high in the atmosphere deep into the lower stratosphere, where they can affect ozone levels.

5. S-MODE
About 200 miles off the coast of San Francisco, the Sub-Mesoscale Ocean Dynamics Experiment is using ships, planes and gliders to study the impact that ocean eddies have on how heat moves between the ocean and the atmosphere.

These missions are kicking off in January, so stay tuned for our updates from the field! You can follow along with NASA Expeditions on Twitter and Facebook.

Make sure to follow us on Tumblr for your regular dose of space: http://nasa.tumblr.com.
What’s aboard SpaceX’s Dragon?
On Dec 5. 2019, a SpaceX Falcon 9 rocket blasted off from Cape Canaveral Air Force Station in Florida carrying a Dragon cargo capsule filled with dozens of scientific experiments. Those experiments look at everything from malting barley in microgravity to the spread of fire.

Not only are the experiments helping us better understand life in space, they also are giving us a better picture of our planet and benefiting humanity back on Earth.
📸 A Better Picture of Earth 🌏
Every material on the Earth’s surface – soil, rocks, vegetation, snow, ice and human-made objects – reflects a unique spectrum of light. The Hyperspectral Imager Suite (HISUI) takes advantage of this to identify specific materials in an image. It could be useful for tasks such as resource exploration and applications in agriculture, forestry and other environmental areas.

🌱 Malting Barley in Microgravity 🌱
Many studies of plants in space focus on how they grow in microgravity. The Malting ABI Voyager Barley Seeds in Microgravity experiment is looking at a different aspect of plants in space: the malting process. Malting converts starches from grain into various sugars that can be used for brewing, distilling and food production. The study compares malt produced in space and on the ground for genetic and structural changes, and aims to identify ways to adapt it for nutritional use on spaceflights.

🛰️ A First for Mexico 🛰️
AztechSat-1, the first satellite built by students in Mexico for launch from the space station, is smaller than a shoebox but represents a big step for its builders. Students from a multidisciplinary team at Universidad Popular Autónoma del Estado de Puebla in Puebla, Mexico, built the CubeSat. This investigation demonstrates communication within a satellite network in low-Earth orbit. Such communication could reduce the need for ground stations, lowering the cost and increasing the number of data downloads possible for satellite applications.

🚀 Checking for Leaks 🚀
Nobody wants a spacecraft to spring a leak – but if it happens, the best thing you can do is locate and fix it, fast. That’s why we launched the first Robotic External Leak Locator (RELL) in 2015. Operators can use RELL to quickly detect leaks outside of station and help engineers formulate a plan to resolve an issue. On this latest commercial resupply mission, we launched the Robotic Tool Stowage (RiTS), a docking station that allows the RELL units to be stored on the outside of space station, making it quicker and simpler to deploy the instruments.

🔥 The Spread of Fire 🔥
Understanding how fire spreads in space is crucial for the safety of future astronauts and for controlling fire here on Earth. The Confined Combustion investigation examines the behavior of flame as it spreads in differently-shaped spaces in microgravity. Studying flames in microgravity gives researchers a chance to look at the underlying physics and basic principles of combustion by removing gravity from the equation.

💪 Staying Strong 💪
Here on Earth you might be told to drink milk to grow up with strong bones, but in space, you need a bit more than that. Astronauts in space have to exercise for hours a day to prevent substantial bone and muscle loss. A new experiment, Rodent Research-19, is seeing if there is another way to prevent the loss by targeting signaling pathways in your body at the molecular level. The results could also support treatments for a wide range of conditions that cause muscle and bone loss back here on Earth.

Want to learn about more investigations heading to the space station (or even ones currently under way)? Make sure to follow @ISS_Research on Twitter and Space Station Research and Technology News on Facebook.
If you want to see the International Space Station with your own eyes, check out Spot the Station to see it pass over your town.
Make sure to follow us on Tumblr for your regular dose of space: http://nasa.tumblr.com.
The Island Named After a Satellite
It is so small that you cannot see it on Google maps. It measures 25 by 45 meters (27 by 49 yards), about half the size of a football field. This barren bit of rock off the coast of Canada also has an unusual namesake: the Landsat 1 satellite. The small size is actually what made the island notable in 1973, when it was initially discovered. Well, that, and the polar bear trying to eat one of the surveyors.
Betty Fleming, a researcher with the Topographic Survey of Canada, was hunting for uncharted islands and rocks amidst data from the new Landsat 1 satellite. She was particularly interested in the new satellite's ability to find small features. Working with the Canadian Hydrographic Service, Fleming scanned images of the Labrador coast, an area that was poorly charted. About 20 kilometers (12 miles) offshore, the satellite detected a tiny, rocky island. Surveyors were sent to verify the existence of the island and encountered a hungry polar bear on the island. The surveyor quickly retreated. Eventually, the island became known as “Landsat Island,” after the satellite that discovered it. Watch the video to learn more about Betty Fleming and how Landsat Island was discovered by satellite and ground surveyors.
For more details about Landsat Island, read the full stories here:
The Island Named After a Satellite
The Unsung Woman Who Discovered an Unknown Island
Make sure to follow us on Tumblr for your regular dose of space: http://nasa.tumblr.com.
What Does Two Decades of Rain and Snow Show Us?
You are seeing the culmination of almost twenty years of rain and snow, all at once.

For the first time, we have combined and remastered the satellite measurements from two of our precipitation spacecraft to create our most detailed picture of our planet’s rain and snowfall. This new record will help scientists better understand normal and extreme rain and snowfall around the world and how these weather events may change in a warming climate.

The Most Extreme Places on Earth
Using this new two-decade record, we can see the most extreme places on Earth.
The wettest places on our planet occur over oceans. These extremely wet locations tend to be very concentrated and over small regions.
A region off the coast of Indonesia receives on average 279 inches of rain per year.

An area off the coast of Colombia sees on average 360 inches of rain per year.

The driest places on Earth are more widespread. Two of the driest places on Earth are also next to cold ocean waters. In these parts of the ocean, it rains as little as it does in the desert -- they’re also known as ocean deserts!
Just two thousand miles to the south of Colombia is one of the driest areas, the Atacama Desert in Chile that receives on average 0.64 inches of rain per year.

Across the Atlantic Ocean, Namibia experiences on average 0.49 inches of rain a year and Egypt gets on average 0.04 inches of rain per year.

Global Patterns
As we move from January to December, we can see the seasons shift across the world.

During the summer in the Northern Hemisphere, massive monsoons move over India and Southeast Asia.

We can also see dynamic swirling patterns in the Southern Ocean, which scientists consider one of our planet’s last great unknowns.

Close-up Patterns
This new record also reveals typical patterns of rain and snow at different times of the day -- a pattern known as the diurnal cycle.
As the Sun heats up Earth’s surface during the day, rainfall occurs over land. In Florida, sea breezes from the Gulf of Mexico and Atlantic Ocean feed the storms causing them to peak in the afternoon. At night, storms move over the ocean.

In the winter months in the U.S. west coast, the coastal regions generally receive similar amounts of rain and snow throughout the day. Here, precipitation is driven less from the daily heating of the Sun and more from the Pacific Ocean bringing in atmospheric rivers -- corridors of intense water vapor in the atmosphere.

This new record marks a major milestone in the effort to generate a long-term record of rain and snow. Not only does this long record improve our understanding of rain and snow as our planet changes, but it is a vital tool for other agencies and researchers to understand and predict floods, landslides, disease outbreaks and agricultural production.
Make sure to follow us on Tumblr for your regular dose of space: http://nasa.tumblr.com

NASA Spotlight: Astronaut Candidate Frank Rubio
“Where else in the world would you hear a story like mine? I’m a kid from a single mom, a teenage mom from El Salvador who worked in all sorts of low-income jobs... My story is a great story about America. What are the chances that a kid like me would end up being where I am today?” - Frank Rubio
Dr. Frank Rubio is a Los Angeles-born Salvadorian-American who was selected as NASA astronaut candidate in 2017. The Florida native graduated from the U.S. Military Academy and earned a Doctorate of Medicine from the Uniformed Services University of the Health Sciences. Prior to attending medical school, he served as a UH-60 Blackhawk helicopter pilot and flew more than 1,100 hours, including more than 600 hours of combat and imminent danger time during deployments to Bosnia, Afghanistan and Iraq. Dr. Rubio is a board certified family physician and flight surgeon. At the time of his selection, he was serving in the 10th Special Forces Group (Airborne).
Frank took time from training to become a certified NASA Astronaut to answer questions about his life and career:
You’ve served in the Special Forces, are certified as a family physician and now are a selected Astronaut candidate – What inspired you to apply to be an astronaut and how do you think your past jobs will play a role in your new career?
It was a friend in the astronaut corps that recommended I put in an application. After he recommended it, I thought it was an amazing opportunity to be a part of something bigger than myself and to allow me to continue to serve. It gave me an opportunity to explore and make a difference. And it sounded like a lot of fun! My past careers have allowed me to be comfortable with uncertainty and the unknown and to function well despite often not having all the facts.
Do you have any secret skills, talents, or hobbies?
I was on the skydive team in college.

How would you describe your job to a five year old?
I have one of the best jobs in the world because I get to train and work towards a mission that helps humankind. My job is unique in that you and your team are working to make a difference from a much bigger perspective. And hopefully I get to ride on a rocket and go to space!

What is the best advice you’ve ever received?
Early in my career and throughout my career I was assigned to jobs that may not have been my first choice, but they turned out to be amazing opportunities. I was taught to have a good attitude and give it your best no matter where you are. Those opportunities ended up being some of the best and helped me get where I am today.
Any facts about/aspects of astronaut training that you think people would be surprised to find out?
A lot of people don’t realize how much studying is involved. It’s comparable to the studying I did in flight school or medical school.
What are five things that you will definitely take with you on your first space flight?
Pictures of my family and friends, a Bible and lots of books to read (probably on a tablet), patches from my Army units- they helped form me to be the person I am today, music, and if I could take my dog (and family), I definitely would! Also, Something for each of my kids to give to them.
You just finished up geology training. What fact or skill did you learn during geology training that you think rocks the most?
The overall idea that the rocks and the different units we studied have so much to tell. You learn to appreciate how much the layout of the land and the rocks and the way they interact together can tell you about the history of that place. It’s amazing.

Since you’re getting close to completing astronaut training, what about your first space flight are you most looking forward to?
Everything will be fantastic from the ride up there, to floating in space, to the amazing science we get to perform, to being part of the team. I don’t think I’ll ever get tired of looking back at Earth and having the chance to get the perspective to recognize the grandeur and uniqueness of Earth.
What would be the first thing you would say if you happened to make contact with an alien lifeform able to communicate with you?
Hello! How are you? I would want to know about them and to share humankind with them.
Thank you for your time Frank, and good luck as you continue to complete astronaut training!
Make sure to follow us on Tumblr for your regular dose of space: http://nasa.tumblr.com.

NASA Spotlight: Brandon Rodriguez, Jet Propulsion Laboratory Education Specialist
Brandon Rodriguez is an education specialist at our Jet Propulsion Laboratory (JPL) in Pasadena, California where he provides resources and training to K-12 schools across the Southwest. Working with a team at JPL, he develops content for classroom teachers, visits schools and speaks with students and trains future teachers to bring NASA into their classroom. When he’s not in the classroom, Brandon’s job takes him on research expeditions all around the world, studying our planet’s extreme environments.
Fun fact: Brandon wakes up every morning to teach an 8 a.m. physics class at a charter school before heading to JPL and clocking in at his full time job. When asked why? He shared, “The truth is that I really feel so much better about my role knowing that we’re not ‘telling’ teachers what to do from our ivory tower. Instead, I can “share” with teachers what I know works not just in theory, but because I’m still there in the classroom doing it myself.” - Brandon Rodriguez
Brandon took time from exciting the next generation of explorers to answer some questions about his life and his career:
What inspired you to work in the educational department at NASA?
I was over the moon when I got a call from NASA Education. I began my career as a research scientist, doing alternative energy work as a chemist. After seven years in the field, I began to feel as if I had a moral responsibility to bring access to science to a the next generation. To do so, I quit my job in science and became a high school science teacher. When NASA called, they asked me if I wanted a way to be both a scientist and an educator- how could I resist?

You were born in Venezuela and came to the U.S. when you were 12 years old. Can you tell us the story of why and how you came to America?
I haven't been back to Venezuela since I was very young, which has been very difficult for me. Being an immigrant in the USA sometimes feels like you're an outsider of both sides: I'm not truly Latin, nor am I an American. When I was young, I struggled with this in ways I couldn't articulate, which manifested in a lot of anger and got me in quite a bit of trouble. Coming to California and working in schools that are not only primarily Latinx students, but also first generation Latinx has really helped me process that feeling, because it's something I can share with those kids. What was once an alienating force has become a very effective tool for my teaching practice.
Does your job take you on any adventures outside of the classroom and if so, what have been your favorite endeavors?
I'm so fortunate that my role takes me all over the world and into environments that allow to me to continue to develop while still sharing my strengths with the education community. I visit schools all over California and the Southwest of the USA to bring professional development to teachers passionate about science. But this year, I was also able to join the Ocean Exploration Trust aboard the EV Nautilus as we explored the Pacific Remote Island National Marine Monument. We were at sea for 23 days, sailing from American Samoa to Hawaii, using submersible remotely operated vehicles to explore the ocean floor.

Image Credit: Nautilus Live
We collected coral and rock samples from places no one has ever explored before, and observed some amazing species of marine creatures along the way.

Image Credit: Nautilus Live
What keeps you motivated to go to work every day?
There's no greater motivation than seeing the product of your hard work, and I get that everyday through students. I get to bring them NASA research that is "hot off the press" in ways that their textbooks never can. They see pictures not online or on worksheets, but from earlier that day as I walked through JPL. It is clearly that much more real and tangible to them when they can access it through their teacher and their community.

Do you have any tips for people struggling with their science and math classes?
As someone who struggled- especially in college- I want people to know that what they struggle with isn't science, it's science classes. The world of research doesn't have exams; it doesn't have blanks to be filled in or facts to be memorized. Science is exploring the unknown. Yes, of course we need the tools to properly explore, and that usually means building a strong academic foundation. But it helped me to differentiate the end goal from the process: I was bad at science tests, but I wanted to someday be very good at science. I could persevere through the former if it got me to the latter.
If you could safely visit any planet, star, or solar system, where would you visit and what would you want to learn?
Europa, without a doubt. Imagine if we found even simple life once more in our solar system- and outside of the habitable zone, no less. What would this mean for finding life outside of our solar system as a result? We would surely need to conclude that our sky is filled with alien worlds looking back at us.

Is there a moment or project that you feel defined (or significantly impacted) your career up to today?
While I never worked closely with the mission, Insight was a really important project for me. It's the first time while at JPL I was able to see the construction, launch and landing of a mission.
If you could name a spaceship, what would you name it?
For as long as I can remember, I've been watching and reading science fiction, and I continue to be amazed at how fiction informs reality. How long ago was it that in Star Trek, the crew would be handing around these futuristic computer tablets that decades later would become common iPads? In their honor, I would be delighted if we named a ship Enterprise.
Thanks so much Brandon!
Additional Image Credit: MLParker Media
Make sure to follow us on Tumblr for your regular dose of space: http://nasa.tumblr.com
We’re On a Mission to Study The Zone Where Earth Meets Space!
We’re launching ICON — short for Ionospheric Connection Explorer — a mission to explore the dynamic region where Earth meets space: the ionosphere!

Earth’s ionosphere stretches from 50 to 400 miles above the ground, overlapping the top of our atmosphere and the very beginning of space. The Sun cooks gases there until they lose an electron (or two or three), creating a sea of electrically charged particles. But, the ionosphere also responds to weather patterns from Earth rippling up. These changes are complex and tricky to understand.

That’s why we’re launching ICON! Changes in the ionosphere can affect astronauts, satellites and communications signals we use every day, like radio or GPS. Understanding these changes could help us eventually predict them — and better protect our technology and explorers in space.

ICON will track changes in the ionosphere by surveying airglow. It’s a natural feature of Earth’s that causes our atmosphere to constantly glow. The Sun excites gases in the upper atmosphere, so they emit light. From 360 miles above Earth, ICON will photograph airglow to measure the ionosphere’s winds, composition and temperature. ICON also carries an instrument that will capture and measure the particles directly around the spacecraft.

ICON is scheduled to launch on Oct. 10, on a Northrop Grumman Pegasus XL rocket. The night of launch, the rocket is flown up to the sky by Northrop Grumman’s L-1011 Stargazer airplane, which takes off from Cape Canaveral Air Force Station in Florida. From 40,000 feet above the open ocean, the Pegasus XL rocket drops from the plane and free-falls for about five seconds before igniting and carrying ICON into orbit.

NASA TV coverage of the launch starts at 9:15 p.m. EDT on Oct. 10 at nasa.gov/live. You can also follow along on Twitter, Facebook or at nasa.gov/icon.
Make sure to follow us on Tumblr for your regular dose of space: http://nasa.tumblr.com.
The Smoke From a (Not-so) Distant Fire
Flying directly through thick plumes of smoke may seem more harrowing than exciting. But for members of the CAMP2Ex science team, the chance to fly a P-3 Orion straight through clouds of smoke billowing off fires from Borneo this week was too good an opportunity to pass up.

CAMP2Ex stands for the Cloud, Aerosol and Monsoon Processes in the Philippines Experiment. The 2, by the way, is silent.

It’s a field campaign based out of Clark in the Philippines, flying our P-3, a Learjet and collaborating with researchers on the research vessel Sally Ride to understand how tiny particles in the atmosphere affect cloud formations and monsoon season.

The tiny aerosol particles we’re looking at don’t just come from smoke. Aerosol particles also come from pollution, billowing dust and sea salt from the ocean. They can have an outsized effect on weather and climate, seeding clouds that bring rain and altering how the atmosphere absorbs the Sun’s heat.

The smoke we were flying Monday came from peat fires, burning through the soil. That’s pretty unusual — the last time Borneo had these kind of fires was in 2015, so it was a rare opportunity to sample the chemistry of the smoke and find out what’s mixing with the air.

The planes are loaded with instruments to learn more about aerosol particles and the makeup of clouds, like this high-speed camera that captures images of the particles in flight.

One instrument on the plane collects droplets of cloud water as the plane flies through them, and on the ground, we test how acidic and what kind of particles form the cloud drops.

All of these measurements are tools in improving our understanding of the interaction between particles in the air and clouds, rainfall and precipitation in the Pacific Ocean.

Learn more about the CAMP2Ex field campaign, here!
Make sure to follow us on Tumblr for your regular dose of space: http://nasa.tumblr.com
Our Eyes in the Sky See Toxic Waters
Warm summer temperatures often lead to dangerous blooms of phytoplankton in lakes, reservoirs and along our coastlines. These toxin-containing aquatic organisms can sicken people and pets, contaminate drinking water, and force closures at boating and swimming sites.

In this image, a severe bloom of toxic blue-green algae is spreading across the western half of Lake Erie. Taken on July 30, 2019 by the Operational Land Imager on our Landsat 8 satellite, this image shows green patches where the bloom was most dense and where toxicity levels were unsafe for recreational activities. Around the time of this image, the bloom covered about 300 square miles of Lake Erie’s surface, roughly the size of New York City. By August 13, the bloom had doubled to more than 620 square miles. That’s eight times the size of Cleveland.

The dominant organism—a Microcystis cyanobacteria—produces the toxin microcystin, can cause liver damage, numbness, dizziness, and vomiting. On July 29, 2019, the National Oceanic Atmospheric Administration (NOAA) reported unsafe toxin concentrations in Lake Erie and have since advised people (and their pets) to stay away from areas where scum is forming on the water surface.
You can stay informed about harmful algal blooms using a new mobile app that will send you alerts on potentially harmful algal blooms in your area. Called CyAN, it's based on NASA satellite data of the color changes in lakes and other bodies of water. It serves as our eye-in-the-sky early warning system, alerting the public and local officials to when dangerous waters may be in bloom.
Make sure to follow us on Tumblr for your regular dose of space: http://nasa.tumblr.com.
The Summer Solstice Has Arrived!
This year’s summer solstice for the northern hemisphere arrives at 11:54 a.m. EDT, meaning today is the longest day of the year! The number of daylight hours varies by latitude, so our headquarters in Washington, D.C. will see 14 hours, 53 minutes, and 51 seconds of daylight. A lot can happen in that time! Let’s find out more.

If you’re spending the day outside, you might be in the path of our Earth Science Satellite Fleet (ESSF)! The fleet, made up of over a dozen Earth observation satellites, will pass over the continental United States about 37 times during today’s daylight hours.

These missions collect data on atmospheric chemistry and composition, cloud cover, ocean levels, climate, ecosystem dynamics, precipitation, and glacial movement, among other things. They aim to do everything from predicting extreme weather to helping informing the public and decision makers with the environment through GPS and imaging. Today, their sensors will send back over 200 gigabytes (GB) of data back to the ground by sunset.

As the sun sets today, the International Space Station (ISS) will be completing its 10th orbit since sunrise. In that time, a little more than 1 terabyte-worth of data will be downlinked to Earth.

That number encompasses data from ground communications, payloads, experiments, and control and navigation signals for the station. Approximately 330 GB of that TB is video, including live broadcasts and downlinks with news outlets. But as recently-returned astronaut Serena Auñón-Chancellor likes to point out, there’s still room for fun. The astronauts aboard the ISS can request YouTube videos or movies for what she likes to call “family movie night.”

Astronauts aboard the station also send back images—LOTS of them. Last year, astronauts sent back an average of 66,912 images per month! During today’s long hours of daylight, we expect the crew to send back about 656 images. But with Expedition 59 astronauts David Saint-Jacques (CSA), Anne McClain (NASA), and Oleg Kononenko (RKA) hard at work preparing to return to Earth on Monday, that number might be a little less.

Say you’re feeling left out after seeing the family dinners and want to join the crew. Would you have enough daylight to travel to the ISS and back on the longest day of the year? Yes, but only if you’re speedy enough, and plan your launch just right. With the current fastest launch-to-docking time of about six hours, you could complete two-and-a-half flights to the ISS today between sunrise and sunset.

When returning from orbit, it’s a longer ordeal. After the Expedition 59 trio arrives on Earth Monday night, they’ll have to travel from Kazakhstan to Houston to begin their post-flight activities. Their journey should take about 18 hours and 30 minutes, just a few hours longer than the hours of daylight we’ll see today.

Happy solstice! Make sure to tune in with us on Monday night for live coverage of the return of Expedition 59. Until then, enjoy the longest day of the year!
Make sure to follow us on Tumblr for your regular dose of space: http://nasa.tumblr.com.
Water, Water Everywhere; We Track Drops to Drink!
When we think about what makes a planet habitable, we’re often talking about water. With abundant water in liquid, gas (vapor) and solid (ice) form, Earth is a highly unusual planet. Almost 70% of our home planet’s surface is covered in water!

But about 97% of Earth’s water is salty – only a tiny amount is freshwater: the stuff humans, pets and plants need to survive.
Water on our planet is constantly moving, and not just geographically. Water shifts phases from ice to water to vapor and back, moving through the planet’s soils and skies as it goes.
That’s where our satellites come in.

Look at the Midwestern U.S. this spring, for example. Torrential rain oversaturated the soil and overflowed rivers, which caused severe flooding, seen by Landsat.

Our satellites also tracked a years-long drought in California. Between 2013 and 2014, much of the state turned brown, without visible green.

It’s not just rain. Where and when snow falls – and melts – is changing, too. The snow that falls and accumulates on the ground is called snowpack, which eventually melts and feeds rivers used for drinking water and crop irrigation. When the snow doesn’t fall, or melts too early, communities go without water and crops don’t get watered at the right time.

Even when water is available, it can become contaminated by blooms of phytoplankton, like cyanobacteria . Also known as blue-green algae, these organisms can make humans sick if they drink the water. Satellites can help track algae from space, looking for the brightly colored blooms against blue water.


Zooming even farther back, Earth’s blue water is visible from thousands of miles away. The water around us makes our planet habitable and makes our planet shine blue among the darkness of space.

Knowing where the water is, and where it’s going, helps people make better decisions about how to manage it. Earth’s climate is changing rapidly, and freshwater is moving as a result. Some places are getting drier and some are getting much, much wetter. By predicting droughts and floods and tracking blooms of algae, our view of freshwater around the globe helps people manage their water.
Make sure to follow us on Tumblr for your regular dose of space: http://nasa.tumblr.com.
How NASA Earth Data Aids America

Today we roll out a new communications project that highlights some of the many ways that NASA's Earth observations help people strengthen communities across the United States.
Space for U.S. features stories on how Earth science data is used to make informed decisions about public health, disaster response and recovery and environmental protection. By highlighting advanced technology from a global perspective, our data helps provide people achieve groundbreaking insights.

For example, a family-owned coffee company in Maine used our sunlight, wind and temperature data to determine the placement of their power-generating solar wall.
Space for U.S. features 56 stories illustrating how our science has made an impact in every state in the nation as well as the District of Columbia, Puerto Rico and regions along the Atlantic, Pacific, Gulf of Mexico, and the Great Lakes.

For six decades, we've used the vantage point of space to better understand our home planet and improve lives. Using Space for U.S., you can browse through stories about how applied Earth science either by state or by topics such as animals, disasters, energy, health, land and water. Each click brings you a story about how people are putting NASA data to work.

Explore the true stories behind the innovative technology, groundbreaking insights, and extraordinary collaboration happening right here in the United States with Space for U.S.
Check out "Space for U.S." today! www.nasa.gov/spaceforus

For more information on NASA Earth, head to www.nasa.gov/Earth or https://appliedsciences.nasa.gov.
Make sure to follow us on Tumblr for your regular dose of space: http://nasa.tumblr.com.
Our Planet: 8 Stunning Views of Earth from Space
Swirling clouds, deep blue oceans and textured land- and icescapes are among the many faces of our planet revealed in NASA’s new photo-essay book: Earth. This collection of 69 images captured by satellites tells a story of a 4.5-billion-year-old planet where there is always something new to see. Earth is a beautiful, awe-inspiring place, and it is the only world most of us will ever know. It is your planet. It is NASA’s mission. The book is available now in hardcover and ebook, and online with interactive features.
Here are eight of those breathtaking images for your viewing pleasure.
Channel Country, Australia

These wide floodplains in Queensland, Australia are unique on the planet. Scientists think they are caused by the extreme variation in water and sediment discharges from the rivers. In many years there is no rainfall at all, and the rivers are effectively non-existent. In years of modest rainfall, the main channels will carry some water, sometimes spilling over into narrow water holes known as billabongs.
Every few decades, the floodplain carries extremely high discharges of water. For instance, tropical storms to the north can lead to great water flows that inundate the entire width of the floodplain. On such occasions, the floodplain appears as series of brown and green water surfaces with only tree tops indicating the location of the islands. Such is the case in this image taken from the International Space Station in September 2016.
Grounded in the Caspian, Kazakhstan

A wide variety of ice forms in the Caspian Sea, which stretches from Kazakhstan to Iran. Just offshore, a well-developed expanse of consolidated ice appears bright white. Farther offshore, a gray-white field of chunky, hummocked ice has detached and is slowly drifting around a polynya, an area of open water surrounded by sea ice. That darker patch is actually growing young, thin ice and nilas, a term that designates sea ice crust up to 10 centimeters (4 inches) in thickness.
The close-up shows nilas and a white, diamond-shaped piece of ice. It might look like this chunk is on the move, cutting a path through thinner ice. But it’s more likely that the “diamond” was stuck to the sea bottom and the wind pushed ice around it.
Tsauchab River Bed, Namibia

The Tsauchab River is a famous landmark for the people of Namibia and tourists. Yet few people have ever seen the river flowing with water. In December 2009, an astronaut on the International Space Station caught this glimpse of the Tsauchab River bed jutting into the sea of red dunes. It ends in a series of light-colored, silty mud holes on the dry lake floor.
Like several other rivers around the Namib Desert, the Tsauchab brings sediment down from the hinterland toward the coastal lowland. This sediment is then blown from the river beds, and over tens of millions of years it has accumulated as the red dunes of the Namib Sand Sea.
Taranaki and Egmont, New Zealand

The circular pattern of New Zealand’s Egmont National Park stands out from space as a human fingerprint on the landscape. The park protects the forested and snow-capped slopes around Mount Taranaki (Mount Egmont to British settlers). It was established in 1900, when officials drew a radius of 10 kilometers around the volcanic peak. The colors differentiate the protected forest (dark green) from once-forested pasturelands (light- and brown-green).
Named by the native Maori people, Taranaki stands 2,518 meters (8,260 feet) tall, and it is one of the world’s most symmetric volcanoes. It first became active about 135,000 years ago. By dating lava flows, geologists have figured out that small eruptions occur roughly every 90 years and major eruptions every 500 years. Landsat 8 acquired this image of Taranaki and the park in July 2014.
Storms Stir Up Sediment in Bermuda

In October 2014, the eye of Hurricane Gonzalo passed right over Bermuda. In the process, the potent storm stirred up the sediments in the shallow bays and lagoons around the island, spreading a huge mass of sediment across the North Atlantic Ocean. This Landsat 8 image shows the area after Gonzalo passed through.
The suspended sediments were likely a combination of beach sand and carbonate sediments from around the shallows and reefs. Coral reefs can produce large amounts of calcium carbonate, which stays on the reef flats (where there are coralline algae that also produce carbonate) and builds up over time to form islands.
Framing an Iceberg in the South Atlantic Ocean

In June 2016, the Suomi NPP satellite captured this image of various cloud formations in the South Atlantic Ocean. Note how low stratus clouds framed a hole over iceberg A-56 as it drifted across the sea.
The exact reason for the hole in the clouds is somewhat of a mystery. It could have formed by chance, although imagery from the days before and after this date suggest something else was at work. It could be that the relatively unobstructed path of the clouds over the ocean surface was interrupted by thermal instability created by the iceberg. In other words, if an obstacle is big enough, it can divert the low-level atmospheric flow of air around it, a phenomenon often caused by islands.
Lofted Over Land in Madagascar

Along the muddy Mania River, midday clouds form over the forested land but not the water. In the tropical rainforests of Madagascar, there is ample moisture for cloud formation. Sunlight heats the land all day, warming that moist air and causing it to rise high into the atmosphere until it cools and condenses into water droplets. Clouds generally form where air is ascending (over land in this case), but not where it is descending (over the river). Landsat 8 acquired this image in January 2015.
A Lava Lamp Look at the Atlantic Ocean

Stretching from tropical Florida to the doorstep of Europe, the Gulf Stream carries a lot of heat, salt, and history. This river of water is an important part of the global ocean conveyor belt, moving water and heat from the Equator toward the far North Atlantic. It is one of the strongest currents on Earth and one of the most studied. Its discovery is often attributed to Benjamin Franklin, though sailors likely knew about the current long before they had a name for it.
This image shows a small portion of the Gulf Stream off of South Carolina as it appeared in infrared data collected by the Landsat 8 satellite in April 2013. Colors represent the energy—heat—being emitted by the water, with cooler temperatures in purple and the warmest water being nearly white. Note how the Gulf Stream is not a uniform band but instead has finer streams and pockets of warmer and colder water.
These images are just a few from our new book called Earth. Explore the other 61 images here.
Make sure to follow us on Tumblr for your regular dose of space: http://nasa.tumblr.com
Weathering the Storm with our Global Precipitation Measurement Mission
How much rain falls in a hurricane? How much snow falls in a nor’easter? What even is a nor’easter? These are the sorts of questions answered by our Global Precipitation Measurement Mission, or GPM.
GPM measures precipitation: Rain, snow, sleet, freezing rain, hail, ice pellets. It tells meteorologists the volume, intensity and location of the precipitation that falls in weather systems, helping them improve their forecasting, gather information about extreme weather and better understand Earth’s energy and water cycles.
And putting all that together, one of GPM’s specialties is measuring storms.
GPM is marking its fifth birthday this year, and to celebrate, we’re looking back on some severe storms that the mission measured in its first five years.
1. The Nor’easter of 2018

A nor’easter is a swirling storm with strong northeasterly winds and often lots of snow. In January 2018, the mission’s main satellite, the Core Observatory, flew over the East Coast in time to capture the development of a nor’easter. The storm dumped 18 inches of snow in parts of New England and unleashed winds up to 80 miles per hour!
2. Hurricane Harvey

Hurricane Harvey came to a virtual halt over eastern Texas in August 2017, producing the largest rain event in U.S. history. Harvey dropped up to 5 feet of rain, causing $125 billion in damage. The Core Observatory passed over the storm several times, using its radar and microwave instruments to capture the devastating deluge.
3. Typhoon Vongfong
In October 2014, GPM flew over one of its very first Category 5 typhoons – tropical storms with wind speeds faster than 157 miles per hour. The storm was Typhoon Vongfong, which caused $48 million in damage in Japan, the Philippines and Taiwan. We were able to see both the pattern and the intensity of Vongfong’s rain, which let meteorologists know the storm’s structure and how it might behave.
4. Near Real-Time Global Precipitation Calculations
The Core Observatory isn’t GPM’s only satellite! A dozen other satellites from different countries and government agencies come together to share their microwave measurements with the Core Observatory. Together, they are called the GPM Constellation, and they create one of its most impressive products, IMERG.
IMERG stands for “Integrated Multi-satellitE Retrievals for GPM,” and it uses the info from all the satellites in the Constellation to calculate global precipitation in near real time. In other words, we can see where it’s raining anywhere in the world, practically live.
5. Hurricane Ophelia
Hurricane Ophelia hit Ireland and the United Kingdom in October 2017, pounding them with winds up to 115 miles per hour, reddening the skies with dust from the Sahara Desert and causing more than $79 million in damages. Several satellites from the Constellation passed over Ophelia, watching this mid-latitude weather system develop into a Category 3 hurricane – the easternmost Category 3 storm in the satellite era (since 1970).
From the softest snow to the fiercest hurricanes, GPM is keeping a weather eye open for precipitation around the world. And we’re on cloud nine about that.
Make sure to follow us on Tumblr for your regular dose of space: http://nasa.tumblr.com
10 Ground-breaking Earth Satellite Images from 2018
In 2018, our satellites captured beautiful imagery from throughout the solar system and beyond. However, some of our favorite visualizations are of this very planet. While this list is by no means exhaustive, it does capture some Earth satellite images from this year that are both visually striking as well as scientifically informative. This list also represents a broad variety of Earth’s features, as well as satellite instrumentation. Take a journey with our eyes in the sky!
10. Hurricane Florence

Before making landfall, Hurricane Florence churned in the Atlantic for a full two weeks — making it among the longest-lived cyclones of the 2018 season. When it finally did hit land on Sep. 14, the storm devastated the southeastern U.S. coast with intense winds, torrential rains and severe flooding.
This natural-color image was acquired by MODIS on the Terra Satellite on Sep. 12, 2018.
Images like this, as well as other satellite information, were used to anticipate the impact of the storm. Our Disasters Program created flood proxy maps that were shared with the Federal Emergency Management Agency (FEMA) and the National Guard to estimate how many and which communities would be most affected by the storm, in order to help prepare recovery efforts ahead of time.
9. Australia’s Lake Eyre Basin

The Lake Eyre Basin covers one-sixth of Australia and is one of the world’s largest internally draining river systems. However, the rivers supported by this system are ephemeral, meaning that they only run for short periods of time following unpredictable rain — the rest of the time, the Basin is a dry, arid desert.
However, when the heavy rain comes, the basin erupts in an explosion of green. In this false-color image captured by the Operational Land Imager (OLI) on Landsat 8 on Apr. 25, 2018, you can see how the vegetation completely envelops the spaces where the water has receded. (Flood water is indicated by light blue, and vegetation is indicated by light green.)
Satellites are an excellent tool for tracking greening events that are followed by flooding. These events offer opportunities for predictive tools as well as recreation.
8. Alaska’s Chukchi Sea

A Monet painting comes to life as the Chukchi Sea swirls with microscopic marine algae.
This image was captured off the Alaskan coast by OLI on Landsat 8 on Jun. 18, 2018. After the Arctic sea ice breaks up each spring, the nutrient-rich Bering Sea water mixes with the nutrient-poor Alaskan coastal water. Each type of water brings with it a different type of phytoplankton and the surface waters have just enough light for the algae to populate and flourish. The result is these mesmerizing patterns of turquoise and green.
This image represents one piece of much larger, incredibly complex ecosystem. While one would not normally associate the breaking up of sea ice with phytoplankton blooms, it is an intricate process of the phytoplankton life cycle. The size of the blooms have varied greatly from year to year, and experts are unsure why. Images like these can help scientists track the development of these blooms and link it to other environmental changes.
7. Hawaii’s Kilauea

Sometimes fresh lava is best viewed in infrared.
This false-color image of Kilauea, captured by OLI on Landsat 8 on May 23, 2018, shows the infrared signal emitted by lava flowing toward the sea. The purple areas surrounding the glowing lava are clouds lit from below, indicating that this image was taken through a break in the clouds.
The Puʻu ʻŌʻō Kupaianaha eruption has been continuously spewing red-hot lava since 1983, making it the longest eruption at Kilauea in recorded history. However, new fissures opened up this year that forced many to evacuate the area. Hawaii’s largest lake evaporated in hours and hundreds of homes were destroyed in Vacationland and Kapoho.
Imagery, seismometers and ground-based instruments were used to track the underground movement of magma. Infrared imagery can be incredibly helpful in disasters like this when you to view data that cannot be observed with the naked eye.
6. California’s Woolsey Burn Scar

Nothing quite encapsulates the destruction of a wildfire like a photo from outer space.
This image of the Woolsey Fire aftermath in Southern California was captured on Nov. 18, 2018 by the Advanced Spaceborned Thermal Emission and Reflection Radiometer (ASTER) on the Terra satellite. This false-color infrared image has been enhanced to clearly show the burned vegetation (indicated by brown) and the vegetation that survived unscathed (indicated by green).
The Woolsey Fire clearly left its mark, with almost 152 square miles (394 square km) and 88% of the Santa Monica Mountains National Recreation Area badly burned. Images like this one can assist fire managers in the area plan for recovery.
5. Bangladesh’s Padma River

As the years go by, the Padma River grows and shrinks, twists and turns. It never has a fixed shape, and as a result, thousands of people must regularly adapt to the constant changes in the river’s 75-mile (130-km) shoreline.
This image captured on Jan. 20, 2018 by OLI on Landsat 8 depicts one of the major rivers of Bangladesh. For thirty years, scientists have been tracking the erosion of the river with satellite imagery. Combinations of shortwave infrared, near infrared, and visible light are used to detect differences year-to-year in width, depth, and shape of the river. Sometimes the river splits off, but then rejoins again later. These patterns are created by the river carrying and depositing sediment, shaping the curves of the path of water.
Monitoring the Padma River is going to become especially important as a new bridge development project advances in the Char Janajat area. Although the bridge will most certainly help shorten travel times for citizens, nobody is quite sure how the river erosion might affect the construction and vice versa.
4. Alaska’s Yakutat Glacier

It’s hard to believe that Harlequin Lake was once all dry land — but it only started to form once Yakutat Glacier started melting. The lake appeared at the beginning of the twentieth century, and has been growing rapidly ever since.
In this hauntingly beautiful image, captured on Sep. 21 2018 by OLI on Landsat 8, the effect of climate change is apparent — especially when compared to earlier images of the region.
Unless the climate warming starts to reverse very soon — which scientists consider very unlikely — Yakutat could be gone as soon as 2070.
3. South Africa’s Theewaterskloof

Cape Town is a seaside city planted on the tip of South Africa. It’s a city known for its beaches and biodiversity — it also almost became known as the first major city to officially run out of water.
This image of Cape Town’s largest reservoir — Theewaterskloof — was acquired on Jul. 9th, 2018 by OLI on Landsat 8. By the time this photo was taken, the city’s main reservoirs stood at 55%. This was a huge increase from where it stood just six months earlier: just 13%.
The severe water shortage in the region started in 2015, only to become more threatening after three successive and unusually dry years. The entire city was preparing for Day Zero — the day the tap water would be shut off.
Despite forecasts that Day Zero would arrive in April, a combination of heavier rains and local conservation efforts restored the majority of the reservoir.
2. Aerosol Earth

Aerosols are all around us. From the smoke from a fire, to the dust in the wind to the salt in sea spray — these solid particles and liquid droplets are always swirling in our atmosphere, oftentimes unseen.
The Goddard Earth Observing System Forward Processing (GEOS FP) model uses mathematical equations to model what is happening in our atmosphere. The inputs for its equations — temperature, moisture, wind, etc. — come from our satellites and ground sensors.
This visualization was compiled on Aug. 24, 2018 — obviously a busy day for aerosols in our atmosphere. Swirls of sea salt (indicated by blue) reveal typhoons Soulik and Cimaron heading straight towards South Korea and Japan. A haze of black carbon (indicated by red) suffuse from agricultural burning in Africa and large wildfires in North America. And clouds of dust (indicated by purple) float off the Sahara desert.
1. Camp Fire

With nearly a hundred fatalities, hundreds of thousands of acres burned and billions of dollars of damage, the world watched in horror as Camp Fire grew to become the most destructive California wildfire in recorded history.
This image was captured on Nov. 8, 2018 by OLI on Landsat 8 on the same day Camp Fire ignited. It consolidates both visible light and shortwave-infrared light in order to highlight the active fire. Strong winds and dry conditions literally fanned the flames and spread this wildfire like a rash.
This image has not only become the iconic portrait for Camp Fire, it is also sobering representation of how quickly a fire can grow out of control in a short amount of time. Even from space, you can almost smell the massive plumes of smoke and feel the heat of the fires.
Whether you realize it or not, our Earth satellite missions are collecting data everyday in order to monitor environmental changes and prepare for natural disasters. If your interest is piqued by this list, head over to the Earth Observatory. The Earth Observatory updates daily with fresh, new content — brought to you by none other than our eyes in the sky.
Make sure to follow us on Tumblr for your regular dose of space: http://nasa.tumblr.com
Five Technologies Taking Aeronautics into the Future
Martian helicopters? Electric planes? Quiet supersonic flight?
The flight technologies of tomorrow are today’s reality at NASA. We’re developing a number of innovations that promise to change the landscape (skyscape?) of aviation. Here are five incredible aeronautic technologies currently in development:

1. The X-59 QueSST and Quiet Supersonic Technology
It might sound like an oxymoron, but ‘quiet boom’ technology is all the rage with our Aeronautics Mission Directorate. The X-59 QueSST is an experimental supersonic jet that hopes to reduce the sound of a supersonic boom to a gentle thump. We will gauge public reaction to this ‘sonic thump,’ evaluating its potential impact if brought into wider use. Ultimately, if the commercial sector incorporates this technology, the return of supersonic passenger flight may become a reality!

2. The X-57 Electric Plane
Electric cars? Pfft. We’re working on an electric PLANE. Modified from an existing general aviation aircraft, the X-57 will be an all-electric X-plane, demonstrating a leap-forward in green aviation. The plane seeks to reach a goal of zero carbon emissions in flight, running on batteries fed by renewable energy sources!

3. Second-Generation Search and Rescue Beacons
Our Search and Rescue office develops technologies for distress beacons and the space systems that locate them. Their new constellation of medium-Earth orbit instruments can detect a distress call near-instantaneously, and their second-generation beacons, hitting shelves soon, are an order of magnitude more accurate than the previous generation!
(The Search and Rescue office also recently debuted a coloring book that doesn’t save lives but will keep your crayon game strong.)

4. Earth from the Air
Earth science? We got it.
We don’t just use satellite technology to monitor our changing planet. We have a number of missions that monitor Earth’s systems from land, sea and air. In the sky, we use flying laboratories to assess things like air pollution, greenhouse gasses, smoke from wildfires and so much more. Our planet may be changing, but we have you covered.

5. Icing Research
No. Not that icing.

Much better.
Though we at NASA are big fans of cake frosting, that’s not the icing we’re researching. Ice that forms on a plane mid-flight can disrupt the airflow around the plane and inside the engine, increasing drag, reducing lift and even causing loss of power. Ice can also harm a number of other things important to a safe flight. We’re developing tools and methods for evaluating and simulating the growth of ice on aircraft. This will help aid in designing future aircraft that are more resilient to icing, making aviation safer.
There you have it, five technologies taking aeronautics into the future, safely down to the ground and even to other planets! To stay up to date on the latest and greatest in science and technology, check out our website: www.nasa.gov.
Make sure to follow us on Tumblr for your regular dose of space: http://nasa.tumblr.com.
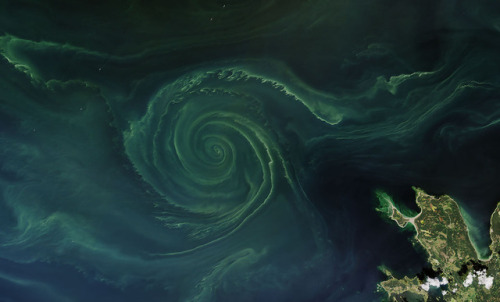
Blooms in the Baltic
Every summer, phytoplankton – microscopic plant-like organisms – spread across the North Atlantic, with blooms spanning hundreds and sometimes thousands of miles. Nutrient-rich, cooler waters tend to promote more growth among marine plants and phytoplankton than is found in tropical waters. Blooms this summer off Scandinavia seem to be particularly intense.
On July 18, 2018, the Operational Land Imager (OLI) on Landsat 8 acquired a natural-color image of a swirling green phytoplankton bloom in the Gulf of Finland, a section of the Baltic Sea. Note how the phytoplankton trace the edges of a vortex; it is possible that this ocean eddy is pumping up nutrients from the depths.
Though it is impossible to know the phytoplankton type without sampling the water, three decades of satellite observations suggest that these green blooms are likely to be cyanobacteria (blue-green algae), an ancient type of marine bacteria that capture and store solar energy through photosynthesis (like plants).
In recent years, the proliferation of algae blooms in the Baltic Sea has led to the regular appearance of “dead zones” in the basin. Phytoplankton and cyanobacteria consume the abundant nutrients in the Baltic ¬and deplete the oxygen. According to researchers from Finland’s University of Turku, the dead zone this year is estimated to span about 70,000 square kilometers (27,000 square miles).
Read more: https://go.nasa.gov/2uLK4aZ
Make sure to follow us on Tumblr for your regular dose of space: http://nasa.tumblr.com.
We See Seashores Shifting with Satellites
If you’re like us, as soon as the summer Sun is out, you start feeling – well, just beachy, sand you very much.
Lots of our favorite beaches are inside protected marine areas, which are regulated by governments to keep their ecosystems or cultural heritage intact. If you beachcomb at Cape Cod, swim in the Florida Keys or learn about Hawaiian culture at Papahānaumokuākea Marine National Monument, congrats! You’ve visited a protected marine area.

But time and tide haven’t been kind to some protected beaches.
Beaches are constantly changing, and science teams are using our 30-year record of Earth images from the NASA/USGS Landsat program to study what’s happening.
Overall, the sum total of sandy beaches has increased a bit over the last 30 years. But time and tide haven’t been as kind to our protected beaches – the team found that more than 1/3 of sandy beaches in protected marine areas have been eroding away.

Some of these areas were designated to protect vulnerable plant and animal species or connect delicate ecosystems. They are home to humpback whales and sea turtles, reefs and mangroves that protect the land from erosion and natural disasters, and species which are found in only one habitat in the world. Losing land area could upset the balance of these areas and endanger their future.

Next step: Looking for pearls of wisdom to save the beaches!
Right now, we aren’t sure which beaches are eroding due to natural processes, and which are due to humans – that’s the next step for science teams to investigate. Once we know the causes, we can start working on solutions to save the beaches.
Those 30 years of Landsat data will help scientists find answers to these questions much faster – instead of using airplanes or measuring the beaches by hand, they can use computer programs to rapidly investigate millions of satellite photos spanning many years of change.

By tracking beaches from space, scientists can help keep our summers sandy for years to come.
And that makes us as happy as clams.
Read the full story HERE.
Make sure to follow us on Tumblr for your regular dose of space: http://nasa.tumblr.com.
Cracking Earth’s Carbon Puzzle
It’s a scientific conundrum with huge implications for our future: How will our planet react to increasing levels of carbon dioxide in the atmosphere?

Carbon – an essential building block for life – does not stay in one place or take only one form. Carbon, both from natural and human-caused sources, moves within and among the atmosphere, ocean and land.

We’ve been a trailblazer in using space-based and airborne sensors to observe and quantify carbon in the atmosphere and throughout the land and ocean, working with many U.S. and international partners.

Our Orbiting Carbon Observatory-2 (OCO-2) is making unprecedented, accurate global measurements of carbon dioxide levels in the atmosphere and providing unique information on associated natural processes.

ABoVE, our multi-year field campaign in Alaska and Canada is investigating how changes in Arctic ecosystems such as boreal forests in a warming climate result in changes to the balance of carbon moving between the atmosphere and land.

This August we’re embarking on an ocean expedition with the National Science Foundation to the northeast Pacific called EXPORTS that will help scientists develop the capability to better predict how carbon in the ocean moves, which could change as Earth’s climate changes.

ECOSTRESS is slated to launch this summer to the International Space Station to make the first-ever measurements of plant water use and vegetation stress on land – providing key insights into how plants link Earth’s global carbon cycle with its water cycle.

Later this year, ECOSTRESS will be joined on the space station by GEDI, which will use a space borne laser to help estimate how much carbon is locked in forests and how that quantity changes over time.

In early 2019, the OCO-3 instrument is scheduled to launch to the space station to complement OCO-2 observations and allow scientists to probe the daily cycle of carbon dioxide exchange processes over much of the Earth.

And still in the early stages of development is the Geostationary Carbon Cycle Observatory (GeoCarb) satellite, planned to launch in the early 2020s. GeoCarb will collect 10 million observations a day of carbon dioxide, methane and carbon monoxide.

Our emphasis on carbon cycle science and the development of new carbon-monitoring tools is expected to remain a top priority for years to come. READ MORE.
Make sure to follow us on Tumblr for your regular dose of space: http://nasa.tumblr.com.