This is a studyblr for everyone have some passion for science, especially astronomy and biology
129 posts
Latest Posts by study-astronomy-biology-ref - Page 4

Three galaxies at once
Rising majestically above the telescopes of ESO’s La Silla Observatory in Chile we see the Milky Way accompanied by its two dwarf neighbour galaxies, the Large and Small Magellanic Clouds.
Credit: ESO/A. Santerne


“NEW GALAXY DISCOVERED ORBITING THE MILKY WAY” You would think that scientists would have already discovered most of the galaxies around the Milky Way, but that does not seem to be the case. Astronomers have recently detected a dwarf galaxy orbiting the Milky Way called the Crater 2 dwarf. This galaxy was discovered through measuring its ‘half-light diameter’. Since galaxies don’t have actual definitive edges, astronomers measure galaxies by looking at the brightest part of the galaxy where half of the total amount of light from the it is emitted - half-light diameter. This galaxy has a half-light diameter of 7000 light years, which would look twice as big as the full moon if we could see it with the naked eye. Gabriel Torrealba and his colleagues at the University of Cambridge, the team that discovered this galaxy, was only able to find it by using a computer that looked for over-densities of stars in data (hinting at the possibilities of galaxies or something else) from images taken by a telescope in Chile. The galaxy has eluded the detection of the scientific community for so long only because its stars are spread out so thinly, giving it a ghost-like appearance. In addition, this dwarf galaxy is near four other new-found objects: the Crater globular star cluster as well as three dwarf galaxies in Leo - a group of objects that is now falling towards the Milky Way. Interestingly, this galaxy is quite new due to it retaining a round shape suggesting that it had never encountered a giant galaxy, otherwise gravity would have bent the dwarf out of shape.
Read more about this fascinating story on: https://www.newscientist.com/article/2084438-never-before-seen-galaxy-spotted-orbiting-the-milky-way/


On October 8 a privileged few could see auroras in abnormally low latitudes, as the spectacular pictures above taken in Wales and Northern England.
Via TON: Northern Lights Put On Spectacular Show As Aurora Borealis Lit Skies Over Wales And Yorkshire.

Saturn’s hexagon
This colorful view from NASA’s Cassini mission is the highest-resolution view of the unique six-sided jet stream at Saturn’s north pole known as “the hexagon.” This movie, made from images obtained by Cassini’s imaging cameras, is the first to show the hexagon in color filters, and the first movie to show a complete view from the north pole down to about 70 degrees north latitude.
Via NASA: In Full View: Saturn’s Streaming Hexagon


WOW!!
This computer-simulated image shows a supermassive black hole at the core of a galaxy. The black region in the center represents the black hole’s event horizon, where no light can escape the massive object’s gravitational grip. The black hole’s powerful gravity distorts space around it like a funhouse mirror. Light from background stars is stretched and smeared as the stars skim by the black hole.
Credits: NASA, ESA, and D. Coe, J. Anderson, and R. van der Marel (STScI)
Full Story at Hubble Space Telescope/NASA.- Behemoth Black Hole Found in an Unlikely Place
High-res images at HubbleSite.org


Cosmic Web
The concept of the cosmic web—viewing the universe as a set of discrete galaxies held together by gravity—is deeply ingrained in cosmology. Yet, little is known about architecture of this network or its characteristics. Our research used data from 24,000 galaxies to construct multiple models of the cosmic web, offering complex blueprints for how galaxies fit together. These three interactive visualizations help us imagine the cosmic web, show us differences between the models, and give us insight into the fundamental structure of the universe.
An awesome work of the Center for Complex Network Research
I MADE AN ART MASTERPOST
Bodies:
how to draw arms
*Hands*
How To Draw Hands
hands hands hands
more hands
another hand tutorial
How to draw butts&thighs
draw knees
draw feet
Kneeling + Sitting ref
Body anatomy help
The male torso
Muscular male with bow stock photos
Lots of Stuff
All about the human body
Pose studies
100+ anatomy references
Sitting poses
pose reference blo
realistic woman body ref
male body
Pose Maker
Poses
hundreds of pose references wowie
a guide to figure drawin
torso reference
How to draw penis
Penis ref
Kissing ref
Faces:
Drawing expressions
Creating expression
Avoiding same face
How to draw faces
*Heads
Heads&Angles
contouring and highlightin
drawing eyes
*How To Draw Noses
drawing ears
how to draw profiles
*How To Draw Lip
lips ref
lip tutorial
Hair:
Hair tutorial
Hair+Fur
how to draw curls
*How To Draw Hair
Clothes:
Drawing clothe folding
How to draw folds
Folding ref
how to draw jeans
hat ref
*How To Draw Fabric Folds/Creases
how to draw shoes/feet
hecka lot of clothing refs
Other (Person Related):
Flower crown tutorial
Drawing horse/animal legs on humans
Anatomy of mutant humans
Mass art ref
Drawing human wings
draw wings
*How To Draw Cuts And Bruises
wings
Other (non-specific):
How to draw ice
Drawing clouds
Creature design
Tutorial masterpost (100+)
How to colour
Drawing ref masterpost (10+)
paint blood
shadow help
draw grass
I made this most for my own benefit to organize this stuff, and have no idea how to make a masterpost!


MARTIAN STORMS - Seen in 1977 by the Viking 2 Orbiter
“Like its predecessor, the Viking 2 mission consisted of a lander and an orbiter designed to take high-resolution images, and study the Martian surface and atmosphere. Both the Viking 1 and 2 landers benefited greatly from their orbiting counterparts, which snapped images that helped mission controllers navigate the landers to safe landing sites.”
This particular image was taken by the Viking 2 Orbiter and shows a massive dust storm on the red planet. This spectacular storm can be seen on a global scale. The Viking 2 mission would end 3 years later on April 11, 1980.
Credit: NASA/JPL


The upper atmosphere of the Sun is dominated by plasma filled magnetic loops (coronal loops) whose temperature and pressure vary over a wide range. The appearance of coronal loops follows the emergence of magnetic flux, which is generated by dynamo processes inside the Sun. Emerging flux regions (EFRs) appear when magnetic flux bundles emerge from the solar interior through the photosphere and into the upper atmosphere (chromosphere and the corona). The characteristic feature of EFR is the Ω-shaped loops (created by the magnetic buoyancy/Parker instability), they appear as developing bipolar sunspots in magnetograms, and as arch filament systems in Hα. EFRs interact with pre-existing magnetic fields in the corona and produce small flares (plasma heating) and collimated plasma jets. The GIFs above show multiple energetic jets in three different wavelengths. The light has been colorized in red, green and blue, corresponding to three coronal temperature regimes ranging from ~0.8Mk to 2MK.
Image Credit: SDO/U. Aberystwyth

Some galaxies have extremely bright cores, suggesting that they contain a supermassive black hole that is pulling in matter at a prodigious rate. Astronomers call these “active galaxies,” and Hercules A is one of them. In visible light, Hercules A looks like a typical elliptical galaxy. In X-ray light, however, Chandra detects a giant cloud of multimillion-degree gas (purple). This gas has been heated by energy generated by the infall of matter into a black hole at the center of Hercules A that is over 1,000 times as massive as the one in the middle of the Milky Way. Radio data (blue) show jets of particles streaming away from the black hole. The jets span a length of almost one million light years.
Credit: X-ray: NASA/CXC/SAO, Optical: NASA/STScI, Radio: NSF/NRAO/VLA


The Earth from Russia’s Elektro-L satellite
This image compilation, comprised of images taken by the Russian Elektro-L weather satellite, was taken from a geostationary orbit at a distance of 36,000 km. It shows the changing illumination of Earth as it rotated on the autumnal equinox and illustrate the concept of a geostationary orbit. At this height, the satellite is orbiting at fast as the earth is spinning and stays in the same location relative to the surface of earth.
Credit: Vitaliy Egorov
Science When the Sun Don’t Shine
About once a year, somewhere on Earth, the sun is blocked by the moon. This phenomenon – called a total solar eclipse – is one of the most beautiful natural events.

Blocking the light of the sun during a total solar eclipse reveals the sun’s relatively faint, feathery atmosphere, called the corona. The corona is one of the most interesting parts of the sun. We usually study it using an instrument called a coronagraph, which uses a solid disk to make an artificial eclipse by blocking the sun’s face.

To successfully block all of the sun’s bright light – which can bend around the sharp edges of a coronagraph disk – coronagraphs must block much more than just the face of the sun. So total solar eclipses are a rare chance to study the lower part of the corona, close to the surface of the sun.

We have sent a team of scientists to Indonesia, where they’re preparing for an experiment during the March 8, 2016, eclipse, visible from Southeast Asia.

The scientists are measuring a certain kind of light – called polarized light – scattered by electrons in the lower corona, which will help us understand the temperature and speed of these electrons.

The March 8 eclipse is a preview of the total solar eclipse that will be visible across the US in August 2017.

Remember, you should never look directly at the sun – even if the sun is partly obscured. This also applies during a total eclipse up until the time when the sun is completely and totally blocked. More on safety: http://go.nasa.gov/1L6xpnI
For more eclipse information, check out nasa.gov/eclipse
Make sure to follow us on Tumblr for your regular dose of space: http://nasa.tumblr.com
It’s Pi Day!
Pi Day, the informal holiday beloved by math enthusiasts — and even by the math averse — is here! March 14 marks the yearly celebration of the mathematical constant π (pi).

What is Pi?
Pi (3.1415….) is the ratio of circumference to diameter in a circle. Any time you want to find out the distance around a circle when you have the distance across it, you will need this formula.
Despite its frequent appearance in math and science, you can’t write pi as a simple fraction or calculate it by dividing two integers. For this reason, pi is said to be “irrational.” Pi’s digits extend infinitely and without any pattern, adding to its intrigue and mystery.
How Do We Use Pi at NASA?

Measurements: Pi can be used to make measurements – like perimeter, area and volume.
For example, sometimes we use lasers to explode ice samples and study their composition. In this scenario, we can uses pi to calculate the width of the laser beam, which in turn can be used to calculate the amount of energy, or fluence, that hits the ice sample. A larger fluence equals a bigger explosion in the ice.

Commanding Rovers: Pi is also used every day commanding rovers on the Red Planet. Everything from taking images, turning the wheels, driving around, operating the robotic arm and even talking to Earth!
Make sure to follow us on Tumblr for your regular dose of space: http://nasa.tumblr.com

i get a LOT of questions about time management and getting better grades so i decided to put a boat load of advice and links in one place :]
time management methods
start a bullet journal ( +mine / +insp )
the 5 day study plan - it works!
schedule blocks of study time
use excel to schedule study
how to schedule study
the sticky note method
an app that organizes time for u
15 ways to beat procrastination
balancing multiple AP classes
decision making and time management
use the pomodoro technique
the task box prioritizing method
how to cram a lot of information in
get organized!!!!!
make and use a syllabible
great organization advice
organize ur study space
more tips on study spaces
basic organization tips
cute infographic
printable planner sheets
simple 2 pocket folder method
study methods!!!
watch youtube crashcourses
best study tips ever tbh
tips on memorizing effectively
add color for visual interest
make cause and effect diagrams
making good flashcards
create summary foldables
margin note taking
the 2 notebook method
for when ur not motivated
reading long textbook passages
studying for a test ooh
basic note taking
+note taking tips
note taking in microsoft word
bs study guide
how to plan out an essay
more essay planning
annotating literature for english
how to make concept maps
really interesting way of studying
shit load of study methods
web resources!!!!
search engine that plants trees!
to do list web program
bedtime calculator [avoid grogginess]
the dictionaries u need omg
how to pull an all nighter
advice on how to properly use google
final grade calculator
>100 places to download literature
cute af school supply list
alternatives to overpriced textbooks
rly this is better than google
best writing checker ever its my fave
free academic journals for research
AP cramming packets
every website to make a bibliography
online used book store
mind map making software from tufts
khanacademy aka bless this site
stop procrastinating websites
free powerpoint
awesome synonym finder
apps u need to download!!!
google chrome app i love it
taking digital notes
like 14 useful school apps
attn: all writers get this
super cute time manager
>9 different studying apps
post it note app
study + give water to needy!!
relaxation n meditation help
sat help!!!!!
all kinds of essential vocab [2k+]
big collection of links
v solid page with lots of references
rly good advice imo
how to do well on the sat
general big exam advices
stress reliefs!!!!
rly good study snacks
badass instrumental playlist!
finish ur essay songs!
+all my fave study playlists!
treat urself on a low budget
read some rad articles
teach urself computer science
take the 10 day study challenge
rip some crap online
good things to do in study breaks
+100 more things in study breaks
if u tired and uninspired
avoid student burnout
watch a ton of broadway musicals
nice things for urself
anxiety relieving background sound
+masterposts!!!
back to school advice
productive summers
note taking methods
starting a study blog
time managements
succeed @ school
ap world history
study instagram
web resources
ap psychology
bullet journals
school advice
happy things
ace ur exams
study sounds
stress reliefs
annotations
essay writin
study 101
printables
sat help
+more
i hope some of this was helpful ~ i also have a youtube channel and instagram account with a whole bunch of study resources!!!! ~ xoxo sareena
Use studying techniques to your advantage:
Got these notebooks for 5 cents so obviously going to buy more than one :D # strongnotebookgameisstrong

There’s a method to my madness I swear!! OK so on avg I seem to use up two of those 80 pg notebooks so I got two for each class. And consequently I needed the 4pack 32pg exercise books.

The 80 page notebook is used for in class notes. As soon as anything important is said it is scribbled down into the notebook. The 4 pack 32 pg exercise book is divided to two groups: Feymann technique and Cornell method.
Feymann Technique
Right after class I grab my textbook, my notebooks and two of my exercise books. I teach myself the lesson primarily with my notes and if I don’t understand something I turn to my textbook. If I am still lost I leave space and note that there is something I need to clarify with my professor. Even while I am doing this, I force myself to decrease the writing and increase the connections between every topic since the 32 pg is quite smaller than the 80 pg.
Thankfully when I am done with this, my 32pg becomes the go to whenever it seems like I am in need of revising a topic since it contains relevant notes from both my textbook and my notebook in my own words.
Cornell Method.
When exam time approaches I convert my notes into the cornell notes so that I can easily test myself with the main ideas and key questions.
There is no better way to revise than to try to make connections. That is all you are going to get tested on since it’s not that hard to spit back words on a page. Instead of being asked about photosynthesis for example, you might be told about some chemical that is sprayed on a plant that will block one process and asked about how that affects the growth of the plant overall. See what I mean?

I usually get a whiteboard and write all of the connections out and in front of me. When THAT is done I write it down in flashcard mode and quiz myself for the next week using the Leitner system, along with the topics that are basically just memorization.
LEITNER SYSTEM

Label 5 boxes 1-4, where 1 is for cards you don’t know and 4 is for cards you are basically a pro in. You frequently test yourself in box 1 (maybe every 30 mins, you choose) and increase the time in which you test yourself until you reach 4, where you would test yourself just once a day.
In the beginning all of your cards go in box 1,and as you get a card right it goes up a level and if you get it wrong it goes down a level. That way you are spending more time with ideas and topics you don’t have a strong hold on, rather than spending equal time with all the topics.
At this point I have rewritten my notes twice in my own words and then converted them into flashcard mode :) I recommend this method when it comes to the sciences or humanities. For the maths I have already done a post about it here.
Hope this helps for those still looking for study techniques!
-F
ATLASGAL Survey of Milky Way Completed
ESO - European Southern Observatory logo. 24 February 2016
The southern plane of the Milky Way from the ATLASGAL survey
A spectacular new image of the Milky Way has been released to mark the completion of the APEX Telescope Large Area Survey of the Galaxy (ATLASGAL). The APEX telescope in Chile has mapped the full area of the Galactic Plane visible from the southern hemisphere for the first time at submillimetre wavelengths — between infrared light and radio waves — and in finer detail than recent space-based surveys. The pioneering 12-metre APEX telescope allows astronomers to study the cold Universe: gas and dust only a few tens of degrees above absolute zero. APEX, the Atacama Pathfinder EXperiment telescope, is located at 5100 metres above sea level on the Chajnantor Plateau in Chile’s Atacama region. The ATLASGAL survey took advantage of the unique characteristics of the telescope to provide a detailed view of the distribution of cold dense gas along the plane of the Milky Way galaxy [1]. The new image includes most of the regions of star formation in the southern Milky Way [2].
The southern plane of the Milky Way from the ATLASGAL survey
The new ATLASGAL maps cover an area of sky 140 degrees long and 3 degrees wide, more than four times larger than the first ATLASGAL release [3]. The new maps are also of higher quality, as some areas were re-observed to obtain a more uniform data quality over the whole survey area. The ATLASGAL survey is the single most successful APEX large programme with nearly 70 associated science papers already published, and its legacy will expand much further with all the reduced data products now available to the full astronomical community [4].
The southern plane of the Milky Way from the ATLASGAL survey (annotated)
At the heart of APEX are its sensitive instruments. One of these, LABOCA (the LArge BOlometer Camera) was used for the ATLASGAL survey. LABOCA measures incoming radiation by registering the tiny rise in temperature it causes on its detectors and can detect emission from the cold dark dust bands obscuring the stellar light. The new release of ATLASGAL complements observations from ESA’s Planck satellite [5]. The combination of the Planck and APEX data allowed astronomers to detect emission spread over a larger area of sky and to estimate from it the fraction of dense gas in the inner Galaxy. The ATLASGAL data were also used to create a complete census of cold and massive clouds where new generations of stars are forming.
Comparison of the central part of the Milky Way at different wavelengths
“ATLASGAL provides exciting insights into where the next generation of high-mass stars and clusters form. By combining these with observations from Planck, we can now obtain a link to the large-scale structures of giant molecular clouds,” remarks Timea Csengeri from the Max Planck Institute for Radio Astronomy (MPIfR), Bonn, Germany, who led the work of combining the APEX and Planck data.
Comparison of the central part of the Milky Way at different wavelengths (annotated)
The APEX telescope recently celebrated ten years of successful research on the cold Universe. It plays an important role not only as pathfinder, but also as a complementary facility to ALMA, the Atacama Large Millimeter/submillimeter Array, which is also located on the Chajnantor Plateau. APEX is based on a prototype antenna constructed for the ALMA project, and it has found many targets that ALMA can study in great detail.
Comparison of the central part of the Milky Way at different wavelengths
Leonardo Testi from ESO, who is a member of the ATLASGAL team and the European Project Scientist for the ALMA project, concludes: “ATLASGAL has allowed us to have a new and transformational look at the dense interstellar medium of our own galaxy, the Milky Way. The new release of the full survey opens up the possibility to mine this marvellous dataset for new discoveries. Many teams of scientists are already using the ATLASGAL data to plan for detailed ALMA follow-up.”
Close look at the ATLASGAL image of the plane of the Milky Way
Notes: [1] The map was constructed from individual APEX observations of radiation with a wavelength of 870 µm (0.87 millimetres). [2] The northern part of the Milky Way had already been mapped by the James Clerk Maxwell Telescope (JCMT) and other telescopes, but the southern sky is particularly important as it includes the Galactic Centre, and because it is accessible for detailed follow-up observations with ALMA. [3] The first data release covered an area of approximately 95 square degrees, a very long and narrow strip along the Galactic Plane two degrees wide and over 40 degrees long. The final maps now cover 420 square degrees, more than four times larger. [4] The data products are available through the ESO archive: http://archive.eso.org/wdb/wdb/adp/phase3_main/form?phase3_collection=ATLASGAL&release_tag=1 [5] The Planck data cover the full sky, but with poor spatial resolution. ATLASGAL covers only the Galactic plane, but with high angular resolution. Combining both provides excellent spatial dynamic range. More information: ATLASGAL is a collaboration between the Max Planck Institute for Radio Astronomy (MPIfR), the Max Planck Institute for Astronomy (MPIA), ESO, and the University of Chile. APEX is a collaboration between the Max Planck Institute for Radio Astronomy (MPIfR), the Onsala Space Observatory (OSO) and ESO. Operation of APEX at Chajnantor is carried out by ESO. ALMA is a partnership of the ESO, the U.S. National Science Foundation (NSF) and the National Institutes of Natural Sciences (NINS) of Japan in cooperation with the Republic of Chile. ALMA is funded by ESO on behalf of its Member States, by NSF in cooperation with the National Research Council of Canada (NRC) and the National Science Council of Taiwan (NSC) and by NINS in cooperation with the Academia Sinica (AS) in Taiwan and the Korea Astronomy and Space Science Institute (KASI). ESO is the foremost intergovernmental astronomy organisation in Europe and the world’s most productive ground-based astronomical observatory by far. It is supported by 16 countries: Austria, Belgium, Brazil, the Czech Republic, Denmark, France, Finland, Germany, Italy, the Netherlands, Poland, Portugal, Spain, Sweden, Switzerland and the United Kingdom, along with the host state of Chile. ESO carries out an ambitious programme focused on the design, construction and operation of powerful ground-based observing facilities enabling astronomers to make important scientific discoveries. ESO also plays a leading role in promoting and organising cooperation in astronomical research. ESO operates three unique world-class observing sites in Chile: La Silla, Paranal and Chajnantor. At Paranal, ESO operates the Very Large Telescope, the world’s most advanced visible-light astronomical observatory and two survey telescopes. VISTA works in the infrared and is the world’s largest survey telescope and the VLT Survey Telescope is the largest telescope designed to exclusively survey the skies in visible light. ESO is a major partner in ALMA, the largest astronomical project in existence. And on Cerro Armazones, close to Paranal, ESO is building the 39-metre European Extremely Large Telescope, the E-ELT, which will become “the world’s biggest eye on the sky”. Links: The ATLASGAL survey: http://www3.mpifr-bonn.mpg.de/div/atlasgal/index.html LABOCA (the LArge BOlometer Camera) : https://www.eso.org/public/teles-instr/apex/laboca/ Max-Planck-Institute for Radio Astronomy (MPIfR): http://www.mpifr-bonn.mpg.de/2169/en Onsala Space Observatory (OSO): http://www.chalmers.se/en/centres/oso/Pages/default.aspx ATLASGAL information at MPIfR: http://www3.mpifr-bonn.mpg.de/div/atlasgal/index.html The Csengeri et al. 2016 paper on the combination with Planck data: http://esoads.eso.org/abs/2016A%26A…585A.104C ATLASGAL papers linked in the ESO Telescope Bibliography: http://telbib.eso.org/?q=atlasgal&boolany=or&boolaut=or&boolti=or&yearto=2016&boolins=or&booltel=or&search=Search ESA’s Planck satellite: http://www.esa.int/Our_Activities/Space_Science/Planck_overview Related article: First ATLASGAL release: https://www.eso.org/public/news/eso0924/ Images, Text, Credits: ESO/APEX/ATLASGAL consortium/NASA/GLIMPSE consortium/ESA/Planck/D. Minniti/S. GuisardAcknowledgement: Ignacio Toledo, Martin Kornmesser/Videos: ESO/APEX/ATLASGAL consortium/NASA/GLIMPSE consortium/ESA/Planck/VVV Survey/D. Minniti/S. Guisard/Acknowledgement: Ignacio Toledo, Martin Kornmesser. Music: Johan B. Monell (www.johanmonell.com). Best regards, Orbiter.ch Full article


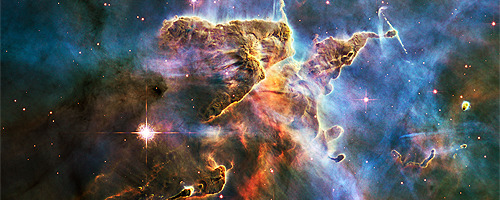
Bits and pieces of the Carina Nebula
A site of intense star formation, the Carina Nebula complex is home to some of the brightest and most massive stars in our Galaxy, the Milky Way.
This immense nebula contains a dozen or more brilliant stars that are estimated to be at least 50 to 100 times the mass of our Sun. The most rich and extensive one is the variable star Eta Carinae.
The visible-light view comes from the MPG/ESO 2.2-metre telescope at the La Silla Observatory and the infrared picture comes from the HAWK-I camera on ESO’s Very Large Telescope.
Credit: ESO


hubble’s panorama of the carina nebula, some 7500 light years away from earth, and about fifty light years in length here. stars old and new illuminate clouds of cosmic dust and gas, like the clumping hydrogen from which they were born.
the top star seen at the bisection of the first two panels, part of the eta carinae binary star system (most stars are in binary systems), is estimated to be more than a hundred times the mass of the sun - large enough to go supernoava in about a million years.
it also produces four million times as much light as the sun, and was once the second brightest star in the night sky. but surrounding dust and gas has dimmed our view of the star, though it’s still visible in the night sky to all but those in the most light polluted cities.
the fifth panel shows ‘the mystic mountain,’ where nascent stars in the dust cloud are spewing hot ionized gas and dust at 850,000 miles an hour. eventually, the ultraviolet radiation from these stars will blow away the dust, leaving visible the stars, like the cluster seen at the top of the panel, which were formed only half a million years ago.


I saw this a long time ago and finally got it to convert to GIF format on tumblr. It shows how it’s the Earth that’s moving, space is standing still. I love this perspective.