Earth Could Lose A Third Of Its Topsoil

Earth Could Lose a Third of Its Topsoil
You might think that dirt doesn’t matter that much — after all there seems to be so much of it all over the planet.
But researchers warn that the world’s precious supply of topsoil — which we need to grow food crops, absorb excess carbon and supply us with new antibiotics — is being lost faster than it can be replenished through natural processes. And the decreasing supply of soil could have a catastrophic effect on agriculture and the world supply of food.
The UN, which designated 2015 as the International Year of Soils, warns that 33 percent of the planet’s soil resources are being degraded due to erosion, pollution, acidification and nutrient depletion — destructive processes that are caused by bad land management. And unless new approaches are adopted, the amount of productive farmland on Earth per person will only amount to one-fourth of the amount available in 1960.
In December, the UN is set to release a report on the state of the world’s soil, and it’s likely to present an even more grim picture, according to a preview in New Scientist. We’re losing soil at the rate of 30 soccer fields per minute, and if we don’t slow the decline, the planet’s entire supply of soil for farming could be gone by 2075.
More Posts from Dotmpotter and Others

Governments aren’t doing much to halt global warming but there is hope in the business world. Here are the companies that are facing up to the challenge.
Not my usual climate post. But, BMW is #1.

FBI chief: It’s ‘unacceptable’ that Guardian has better data on police violence | See full article
The head of the FBI has said it is “ridiculous [and] embarrassing” that the federal government has no better information on police shootings than databases compiled by the Guardian US and the Washington Post.
“It is unacceptable that the Washington Post and the Guardian newspaper from the UK are becoming the lead source of information about violent encounters between [US] police and civilians,” said James Comey, the FBI director.
To see our updated count of police killings in the United States in 2015, visit the Counted database. You can also follow the project on Facebook and Twitter.
Our count as of this afternoon:

An EPIC View of Earth
“Look again at that dot. That’s here. That’s home. That’s us.”
Carl Sagan wrote those words in his book Pale Blue Dot: A Vision For The Human Future In Space. His now-famous ode to our home planet (listen to the full passage here, in animated form) is perhaps our most poignant and humble reminder of the exquisite beauty and shared fragility of this planet we call home.
NASA is now bringing us a daily reminder of that message, thanks to the EPIC camera (a very appropriately named camera, in my opinion) on board NOAA’s DSCOVR satellite. You can see some of its handiwork in the image sequence above.
DSCOVR’s official space job is to observe weather on and around the sun, to extend its mechanical finger into the solar wind and measure how strongly that stream of charged particles is gusting toward Earth. It does this job from a special spot in space called the L1 Lagrange point. If you were to draw a line between us and the sun, DSCOVR would be sitting along it, like so (not to scale):

That’s a convenient place to put a spacecraft, especially one whose job it is to stare at the sun. See, DSCOVR is nestled inside a pocket where it’s tugged equally by the Earth’s and Sun’s gravity, like a stalemate in an orbital game of tug-o-war. Gravity does all the work, and the spacecraft doesn’t need to maneuver much to stay in position. There’s a few of these gravity-neutral Lagrange points out there, as you can tell in the image above, and we’ve got spacecraft residing at all of them.
As a side effect of its sun-staring mission, DSCOVR’s backside happens to be looking back at Earth full-time. In a way, I think that makes it a different sort of moon.
NASA doesn’t like to let any opportunity go un-scienced, of course, so they decided to slap a camera on DSCOVR’s rear, the one named EPIC, and use their stable perch to keep a regular eye on us. Good lookin’ out, NASA.
A little change in perspective can do a planet good. In 1990, from a vantage point beyond Pluto, Voyager 1 turned its cameras back toward home to take one last look, giving us the image that inspired Carl Sagan’s ode to ol’ Dotty Blue:

This was not an easy shot to take. Voyager’s camera wasn’t the fancy digital type like most of us have in our phones. It was essentially an old-fashioned black and white tube TV in reverse, relying on colored filters held in front of the camera to highlight different wavelengths of light. Voyager stored its image data on magnetic tape, and each of the shots took more than five hours to reach Earth. Sagan and NASA’s planetary science team had to practically move the heavens (since they were unable to move the Earth) in order to take that picture.
Now consider the effect this picture has had. That’s home. That’s us. Even if you weren’t born in 1990, everyone and everything that made you is in and on that hazy blue speck. I hope you never lose sight of how amazing it is to view our planet from this perspective.
Luckily, you can get a reminder every day. The DSCOVR satellite is now sending roughly a picture an hour back to Earth, 24/7/365. That’s a near real-time view of our home. Go take a look. It’s pretty epic.
To see a daily look at what a day on Earth looks like, check out EPIC’s daily updates here.

From Hawaii’s flurry of hurricanes, to record high sea ice in Antarctica, and a heat wave that cooked the Australian Open like shrimp on a barbie, 2014 saw some wild weather. How much of that was tied to climate change is what scientists around the world tried to answer in the Bulletin of the American Meteorological Society’s annual attribution report, which was published Thursday.
What they discovered was that the clearest impacts of warming could be found in heat-related events, from heat waves on land to unusually hot ocean waters. Other events, like droughts in East Africa and the Middle East, California’s intense wildfires, and winter storms that continually swept across the eastern U.S., were harder to pinpoint. In part this is because such events are inherently complex, with a multitude of factors influencing them.
For example, while the East African drought was found to be both more likely and more intense because of warming, the situation in the Middle East was less clear, with no discernable climate change connection to the various factors that influenced it. Likewise, no direct push from climate change could be found in California’s wildfire activity, though it is clear that it is increasing the overall wildfire risk there.
And while some events, like the U.S. winter storms and the record high Antarctic sea ice extent, could be pinned to a particular cause, that cause could not be linked to climate change. For other events, like the drought in Brazil and flooding in the Canadian prairies, humans influenced the likelihood in other ways besides the greenhouse gases that continue to be emitted into the atmosphere.
What was clear, though, is that the fast-growing field of what is called extreme event attribution is gaining momentum. Researchers are casting a wider net for extreme events to examine and continually refining their methods. Attribution work has traveled a considerable distance since its inception just over a decade ago.
“Extreme event attribution” is a new topic for me. Very cool science right thar.
![Map Of The Humongous Fungus: The Largest Living Organism On Earth [1936x1310][OC] CLICK HERE FOR MORE](https://64.media.tumblr.com/db929150f86f0c503804f329c0244a28/tumblr_nyulclrmRz1s6c1p2o1_500.jpg)
I like cancelled plans. And empty bookstores. I like rainy days and thunderstorms. And quiet coffee shops. I like messy beds and over-worn pajamas. Most of all, I like the small joys that a simple life brings.
Unknown (via wordsnquotes)

This is just great.


Emily, a process engineer at GE Aviation in Auburn, AL is all suited up to remove a print from a Direct Metal Laser Melting machine. These machines additively manufacture metal components for CFM’s best-selling LEAP jet engine, printing in 20 micron layers — roughly 1/3 the width of a human hair.
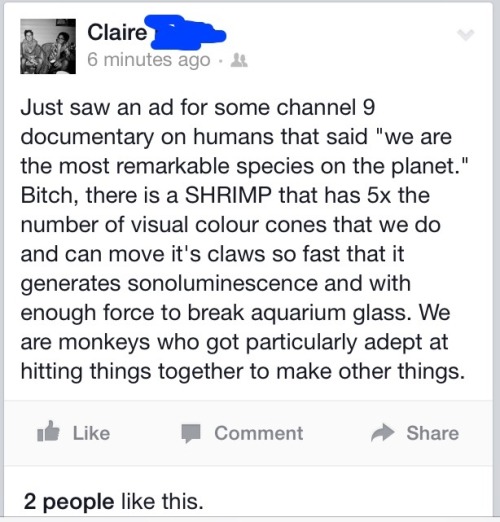
I am not here for the idea that humans > everything else.

Map of Australia with a so called ‘remoteness index’, illustrating how far locations in Australia are from population centers [999x766] CLICK HERE FOR MORE MAPS! thelandofmaps.tumblr.com
-
 haectemporasunt liked this · 5 years ago
 -
 mastersxperversemangelique liked this · 7 years ago
 -
 thematicexistance reblogged this · 8 years ago
 -
thematicexistance reblogged this · 8 years ago
-
thematicexistance reblogged this · 8 years ago
-
 pineapple-clouds liked this · 9 years ago
 -
 dirtfandom reblogged this · 9 years ago
 -
igor-gorgonzola reblogged this · 9 years ago
-
 kristeen93 reblogged this · 9 years ago
 -
kristeen93 liked this · 9 years ago
-
 nmacparlan liked this · 9 years ago
 -
 i-sing-the-body-elektra reblogged this · 9 years ago
 -
 calgal48 reblogged this · 9 years ago
 -
 joviejuliette reblogged this · 9 years ago
 -
 onwardtorakichi reblogged this · 9 years ago
 -
onwardtorakichi liked this · 9 years ago
-
 tigertara liked this · 9 years ago
 -
 berniewong liked this · 9 years ago
 -
 jasmine7031 liked this · 9 years ago
 -
 abdicators-blog liked this · 9 years ago
 -
 basedgqd reblogged this · 9 years ago
 -
 galaxyowls reblogged this · 9 years ago
 -
galaxyowls liked this · 9 years ago
-
 exactlyonewerewolf reblogged this · 9 years ago
 -
 steelsorceress reblogged this · 9 years ago
 -
 cherrynotes reblogged this · 9 years ago
 -
 shadylex reblogged this · 9 years ago
 -
 xxxdragonfucker69xxx liked this · 9 years ago
 -
 marxoteendream liked this · 9 years ago
 -
 testchamber19 liked this · 9 years ago
 -
 wiratomkinder reblogged this · 9 years ago