Apollo 11 Launch
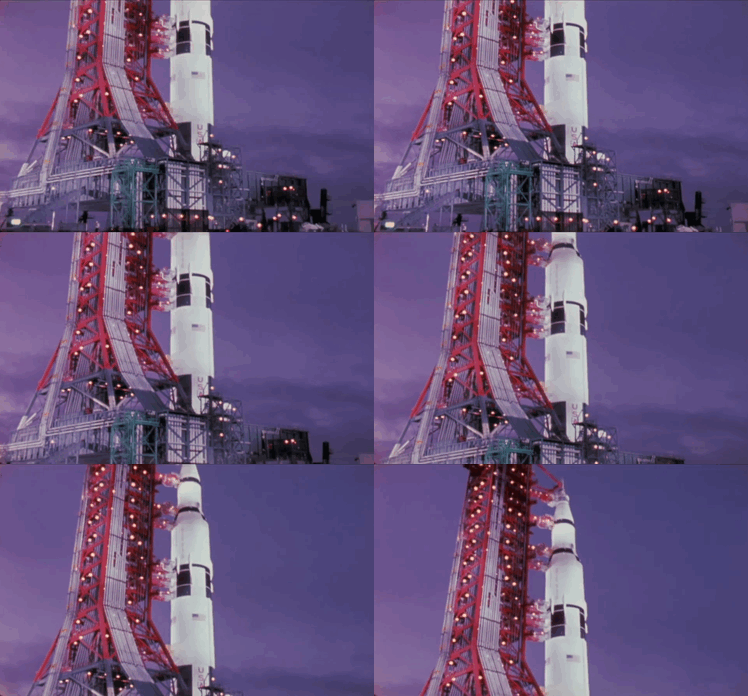
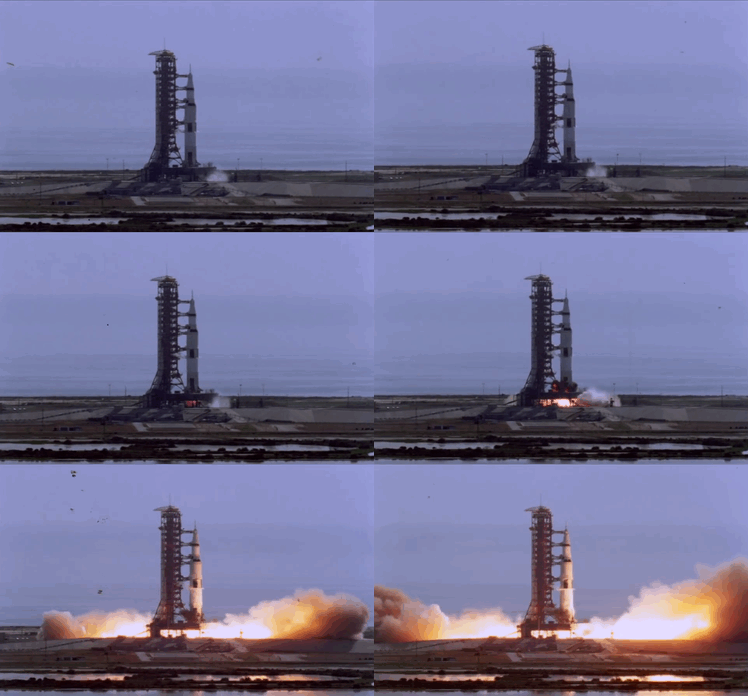

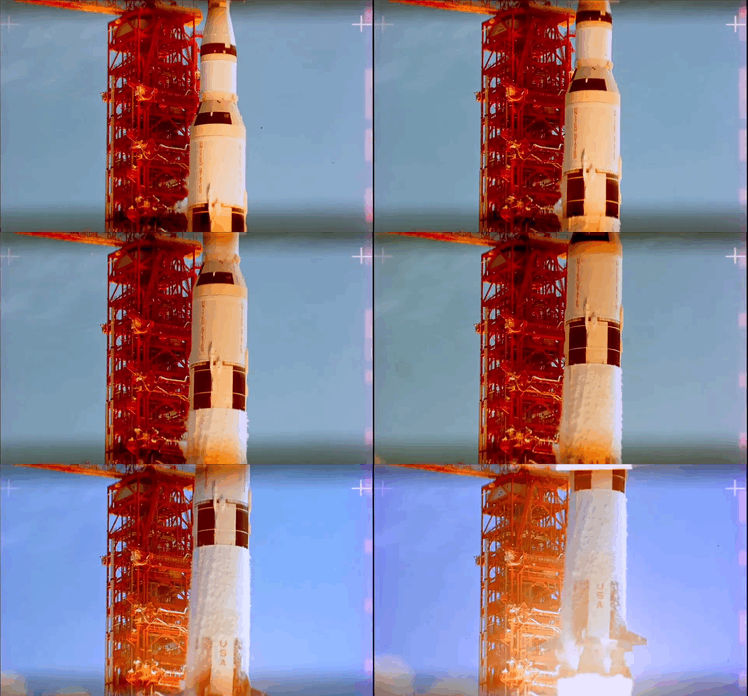
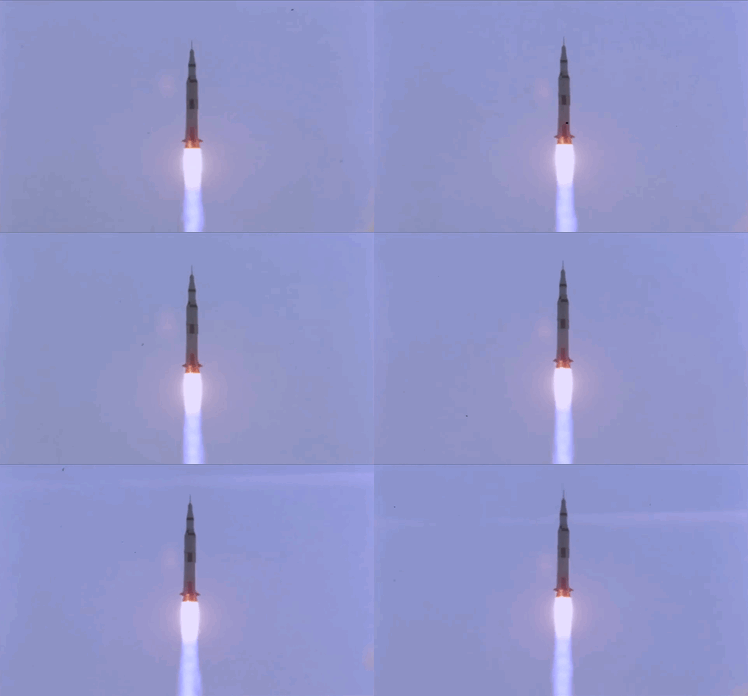
Apollo 11 Launch
More Posts from Ad-astra-affecte-spe and Others
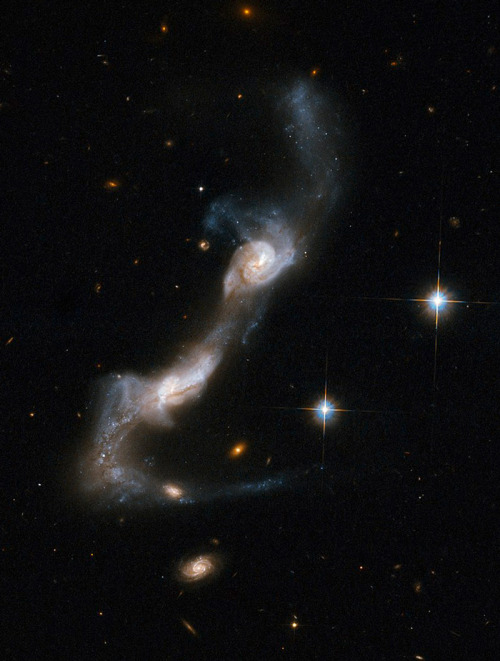
Cosmic Dance of Spiral Galaxies: Arp 238

Eruption of Tvashtar volcano on Jupiter's moon Io (March 1, 2007)

The four giant planets of our Solar System, as seen by NASA's James Webb Telescope.

2023 October 23
Moon Io from Spacecraft Juno Image Credit: NASA, JPL-Caltech, SwRI, MSSS; Processing & Copyright: Ted Stryk & Fernando García Navarro
Explanation: There goes another one! Volcanoes on Jupiter’s moon Io keep erupting. To investigate, NASA’s robotic Juno spacecraft has begun a series of visits to this very strange moon. Io is about the size of Earth’s moon, but because of gravitational flexing by Jupiter and other moons, Io’s interior gets heated and its surface has become covered with volcanoes. The featured image is from last week’s flyby, passing within 12,000 kilometers above the dangerously active world. The surface of Io is covered with sulfur and frozen sulfur dioxide, making it appear yellow, orange and brown. As hoped, Juno flew by just as a volcano was erupting – with its faint plume visible near the top of the featured image. Studying Io’s volcanoes and plumes helps humanity better understand how Jupiter’s complex system of moons, rings, and auroras interact. Juno is scheduled to make two flybys of Io during the coming months that are almost 10 times closer: one in December and another in February 2024.
∞ Source: apod.nasa.gov/apod/ap231023.html
Cosmic Alphabet Soup: Classifying Stars

If you’ve spent much time stargazing, you may have noticed that while most stars look white, some are reddish or bluish. Their colors are more than just pretty – they tell us how hot the stars are. Studying their light in greater detail can tell us even more about what they’re like, including whether they have planets. Two women, Williamina Fleming and Annie Jump Cannon, created the system for classifying stars that we use today, and we’re building on their work to map out the universe.

By splitting starlight into spectra – detailed color patterns that often feature lots of dark lines – using a prism, astronomers can figure out a star’s temperature, how long it will burn, how massive it is, and even how big its habitable zone is. Our Sun’s spectrum looks like this:

Astronomers use spectra to categorize stars. Starting at the hottest and most massive, the star classes are O, B, A, F, G (like our Sun), K, M. Sounds like cosmic alphabet soup! But the letters aren’t just random – they largely stem from the work of two famous female astronomers.

Williamina Fleming, who worked as one of the famous “human computers” at the Harvard College Observatory starting in 1879, came up with a way to classify stars into 17 different types (categorized alphabetically A-Q) based on how strong the dark lines in their spectra were. She eventually classified more than 10,000 stars and discovered hundreds of cosmic objects!

That was back before they knew what caused the dark lines in spectra. Soon astronomers discovered that they’re linked to a star’s temperature. Using this newfound knowledge, Annie Jump Cannon – one of Fleming’s protégés – rearranged and simplified stellar classification to include just seven categories (O, B, A, F, G, K, M), ordered from highest to lowest temperature. She also classified more than 350,000 stars!

Type O stars are both the hottest and most massive in the new classification system. These giants can be a thousand times bigger than the Sun! Their lifespans are also around 1,000 times shorter than our Sun’s. They burn through their fuel so fast that they only live for around 10 million years. That’s part of the reason they only make up a tiny fraction of all the stars in the galaxy – they don’t stick around for very long.

As we move down the list from O to M, stars become progressively smaller, cooler, redder, and more common. Their habitable zones also shrink because the stars aren’t putting out as much energy. The plus side is that the tiniest stars can live for a really long time – around 100 billion years – because they burn through their fuel so slowly.

Astronomers can also learn about exoplanets – worlds that orbit other stars – by studying starlight. When a planet crosses in front of its host star, different kinds of molecules in the planet’s atmosphere absorb certain wavelengths of light.
By spreading the star’s light into a spectrum, astronomers can see which wavelengths have been absorbed to determine the exoplanet atmosphere’s chemical makeup. Our James Webb Space Telescope will use this method to try to find and study atmospheres around Earth-sized exoplanets – something that has never been done before.

Our upcoming Nancy Grace Roman Space Telescope will study the spectra from entire galaxies to build a 3D map of the cosmos. As light travels through our expanding universe, it stretches and its spectral lines shift toward longer, redder wavelengths. The longer light travels before reaching us, the redder it becomes. Roman will be able to see so far back that we could glimpse some of the first stars and galaxies that ever formed.
Learn more about how Roman will study the cosmos in our other posts:
Roman’s Family Portrait of Millions of Galaxies
New Rose-Colored Glasses for Roman
How Gravity Warps Light
Make sure to follow us on Tumblr for your regular dose of space!

Laika: 1954-1957
Opportunity Rover: 2004-2019


The Moon
The most ridiculously detailed" image of Earth’s lunar neighbor was a two-year project captured by two astrophotographers.
The 174-megapixel image, which shows the moon’s colors, craters and glowing aura in stunning detail, was first revealed on Reddit on Saturday. Through Reddit and Instagram, Andrew McCarthy, known for his breathtaking astrophotography skills, teamed up with planetary scientist and fellow photographer Connor Matherne, who has been acclaimed for his striking and vibrant photos of galaxies and nebulae.
The two previously worked together to create an incredible glowing and detailed image of the moon.
-
 kabrox18 reblogged this · 8 months ago
 -
 edminh reblogged this · 9 months ago
 -
 edminh liked this · 9 months ago
 -
 mrpalms liked this · 9 months ago
 -
 wonderingwhatsnext liked this · 9 months ago
 -
 wonderingwhatsnext reblogged this · 9 months ago
 -
 krustyspacepimpadventurediary reblogged this · 9 months ago
 -
 visionautiks liked this · 9 months ago
 -
 powlor liked this · 9 months ago
 -
 roundabouttotheedge reblogged this · 9 months ago
 -
 xploseof reblogged this · 9 months ago
 -
 edweenie liked this · 9 months ago
 -
 cemeterys reblogged this · 9 months ago
 -
 mifawarts reblogged this · 9 months ago
 -
 mortuusflores reblogged this · 10 months ago
 -
 saint-laika reblogged this · 10 months ago
 -
 botryoidal reblogged this · 10 months ago
 -
 sweetannie66 liked this · 10 months ago
 -
 nostalgiaispeace liked this · 10 months ago
 -
 a-god-in-ruins-rises reblogged this · 10 months ago
 -
 acerimmeradel liked this · 10 months ago
 -
 cfnmmakesmehard liked this · 10 months ago
 -
 prettybeatup liked this · 10 months ago
 -
 rauhbutz liked this · 10 months ago
 -
 joespinell reblogged this · 10 months ago
 -
 joespinell liked this · 10 months ago
 -
 lilo15 reblogged this · 10 months ago
 -
 jonovos liked this · 10 months ago
 -
 divaani liked this · 10 months ago
 -
 journeythroughtherain reblogged this · 10 months ago
 -
 weareallinthegutter liked this · 10 months ago
 -
 dagwud reblogged this · 10 months ago
 -
 dagwud liked this · 10 months ago
 -
 faxe72 liked this · 10 months ago
 -
 thunderapache-blog reblogged this · 10 months ago
 -
 thunderapache-blog liked this · 10 months ago
 -
 fusehund reblogged this · 10 months ago
 -
 mikeawood reblogged this · 10 months ago
 -
 mikeawood liked this · 10 months ago
 -
 martinm liked this · 10 months ago
 -
 mdall8 liked this · 10 months ago
 -
 allergic-to-chocolate reblogged this · 10 months ago
 -
 allergic-to-chocolate liked this · 10 months ago
 -
 shallow-www reblogged this · 10 months ago

★•Astronomy, Physics, and Aerospace•★ Original and Reblogged Content curated by a NASA Solar System Ambassador
204 posts


